Validation of the tracking system to measure tests metrics and comparison with the doctor (Stage 2)
Aniol Civit a, Antonio Andriella b, Cristian Barrué a, Maite Antonio c, Concepción Boqué c and Guillem Alenyà a.
a Institut de Robòtica i Informàtica Industrial, CSIC-UPC, C/ Llorens i Artigas 4-6, 08028 Barcelona, Spain.
b PAL Robotics, C/ de Pujades, 77, 08005 Barcelona, Spain
c Oncohematogeriatrics Unit, Institut Català d’Oncologia, IDIBELL Hospitalet, 08908 Barcelona, Spain
Abstract: Frailty is a crucial indicator in determining the well-being of older adults in terms of their health. With the growing number of elderly people, the demand for geriatricians is increasing, which means that they have less time to spend with each patient. The current methods for frailty assessment use simple tests that are time-consuming and do not require specific medical expertise. To address this issue, this paper proposes the use of social robots to assess frailty autonomously. It presents a practical proposal that defines the robot's behavior and explains the design and implementation concepts. Finally, it discusses some of the challenges that may arise from introducing social robots as frailty evaluators.
Short Introduction: In this work, the task of performing autonomous frailty assessments is divided into two stages. In the first stage, the robot locates patients in the waiting room and brings them to the evaluation room. In the second stage, the robot guides them through a series of well-established tests to assess their level of frailty. We discuss here the tests used to assess the physical part of frailty, in an experiment at the Hospital de Bellvitge, and we compare the results obtained compared to the ones obtained from a doctor. The study presents results from a cohort of 22 elderly participants, 10 are current patients from the hospital and 12 are additional volunteer older adults. A ZED2i camera with its SDK is used to extract and track the skeleton of the patient during the test execution.
The different individual tests consist on:
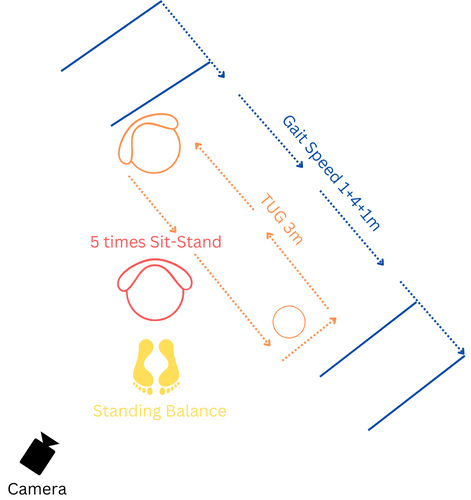
- (SPPB) Standing Balance: The patient has to maintain balance for ten seconds with the feet in three predetermined positions: together, tandem, and semi-tandem.
- (SPPB) Gait Speed: The patient has to walk six meters in a straight line. The first meter corresponds to acceleration and the last one to deceleration. Time is taken on the constant speed phase corresponding to the 4 central meters.
- (SPPB) 5 Times Sit-Stand: It involves standing up and sitting down from a chair five times while measuring the total time taken.
- (TUG) Timed Up and Go: It consists of standing up from a chair, walking three meters towards an object, surrounding it, walking back, and sitting in the same chair.
A distribution example for the tests is shown in Figure 1.
Tracking System Validation
Here, the obtained times from the tests, captured with the ZED2i camera using its SDK, are compared to the ones obtained by a doctor, for all of the 22 older adults.
| Test Metrics | Mean Doctor | Mean Camera | MAPE (%) | R |
|---|---|---|---|---|
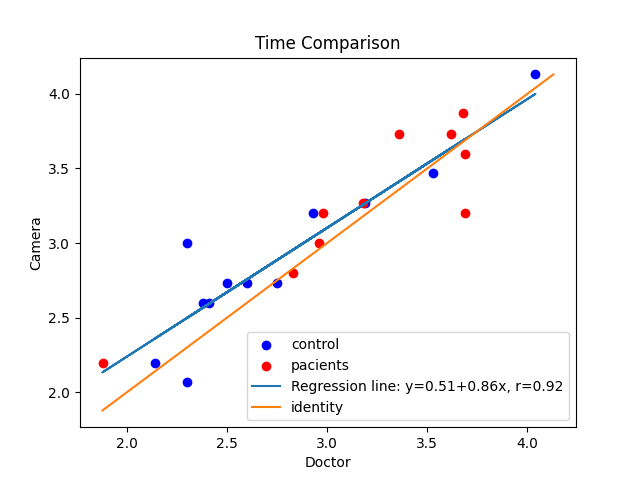
| Gait Speed Time (s) | 2.95 | 3.06 | 6.51 | 0.92 |
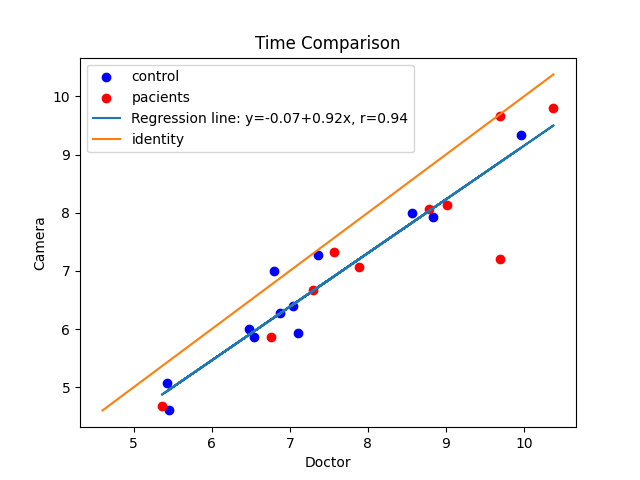
| TUG Time (s) | 7.68 | 7.01 | 8.95 | 0.94 |
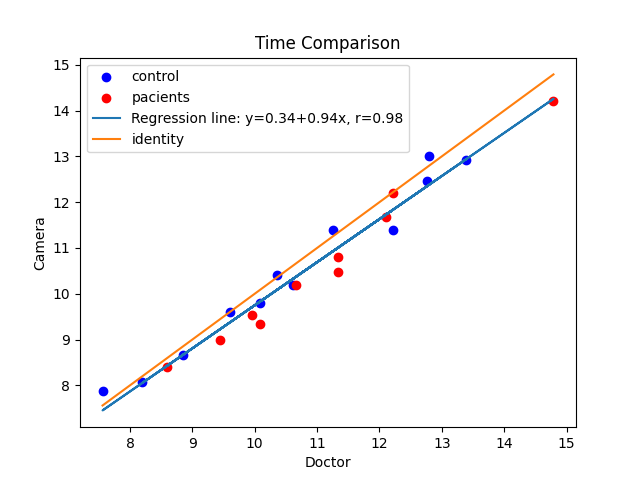
| 5 Times Sit-Stand Time (s) | 10.82 | 10.53 | 3.36 | 0.98 |
| Standing Balance Score | 3.95 | 4 | 1.21 | 0.0 |
The Standing Balance Score is based on the times of each subtes of the Standing Balance test. For the together and semi-tandem positions, it scores one point if the patient completes the 10 seconds without losing balance. For the tandem position, it scores two points if it keeps balance for 10 seconds, one point if kept between 3 and 10 seconds, and 0 points otherwise.
The results show very related computed times between the camera and the doctor. Meaning that the tracking system can be used to measure the physical part of frailty. Additionally, the system can measure additional metrics besides time, which can be related to frailty and risk of falls in older adults.
Validation Results
The individual samples for each of the previous times are plotted below. The plots compare the value acquired with the ZED SDK (y-axis) and the Doctor (x-axis). The linear regression is also plotted in each graphic (orange line), with the identity (green line) which can be used as a reference to check the proper fit of the data. The plots also show the precision and the repeatability of the data, when the samples are closer to the identity line, they are considered more precise.
Gait Speed Time (s)
TUG Time (s)
5 Times Sit-Stand Time(s)