THE PAPER SUBMITTED CAN BE READ AT THE FOLLOWING LINK: LINK TO THE PAPER
Aniol Civit a, Antonio Andriella b, Maite Antonio c, Casimiro Javierre d, Concepción Boqué c and Guillem Alenyà a.
a Institut de Robòtica i Informàtica Industrial, CSIC-UPC, C/ Llorens i Artigas 4-6, 08028 Barcelona
b Artificial Intelligence Research Institute (IIIA-CSIC), Campus de la UAB, 08193 Bellaterra, Barcelona
c Oncohematogeriatrics Unit, Institut Català d’Oncologia, IDIBELL Hospitalet, 08908 Barcelona
d Unitat de Fisiologia. Departament de Ciències Fisiològiques II, Facultat de Medicina (Campus de Bellvitge), Ctra. Feixa Llarga, s/n. 08907 L’Hospitalet de Llobregat, Barcelona
Abstract: Frailty assessment plays a pivotal role in providing older adults care. Currently, the process is time-consuming and involves exercises that are measured using stopwatches. To help reduce the burden on healthcare personnel, this paper introduces a set of methods to be used in robots to autonomously perform frailty assessments. The system employs camera-derived skeletal data to measure standard total time and additional frailty-related metrics. The study presents results from a cohort of 22 elderly participants, in which the assessments were conducted by both medical professionals and our system. The results demonstrate the precision of our approach, achieving a performance close to that of a human. Moreover, we extract supplementary metrics requested by the doctors to enhance the diagnosis. This research represents a significant stride towards the advancement of social robotics in healthcare, offering potential improvements in patient care and clinical decision-making.
Short Introduction: In this work, it is defined and validated a set of methods to automate the commonly used Short Physical Performance Battery (SPPB) and the Timed Up and Go (TUG) tests. The algorithms provide the times and additional and frailty-related metrics that cannot be seen with the human eye. To do so, a ZED2i camera with its SDK is used to extract and track the skeleton of the patient during the test execution. The comparison is done with OptiTrack as a Gold Standard.
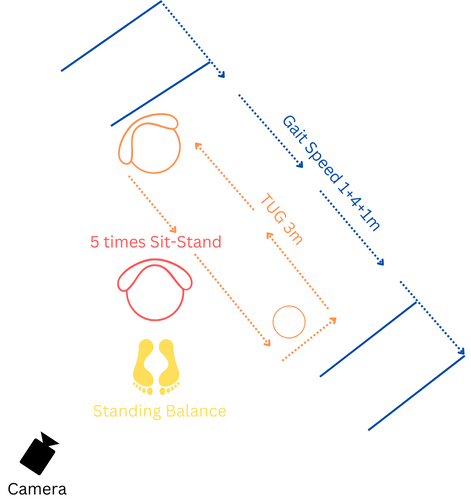
Proposed tests: Examples and distribution
The different individual tests consist on:
- (SPPB) Standing Balance: The patient has to maintain balance for ten seconds with the feet in three predetermined positions: together, tandem, and semi-tandem.
- (SPPB) Gait Speed: The patient has to walk six meters in a straight line. The first meter corresponds to acceleration and the last one to deceleration. Time is taken on the constant speed phase corresponding to the 4 central meters.
- (SPPB) 5 Times Sit-Stand: It involves standing up and sitting down from a chair five times while measuring the total time taken.
- (TUG) Timed Up and Go: It consists of standing up from a chair, walking three meters towards an object, surrounding it, walking back, and sitting in the same chair.
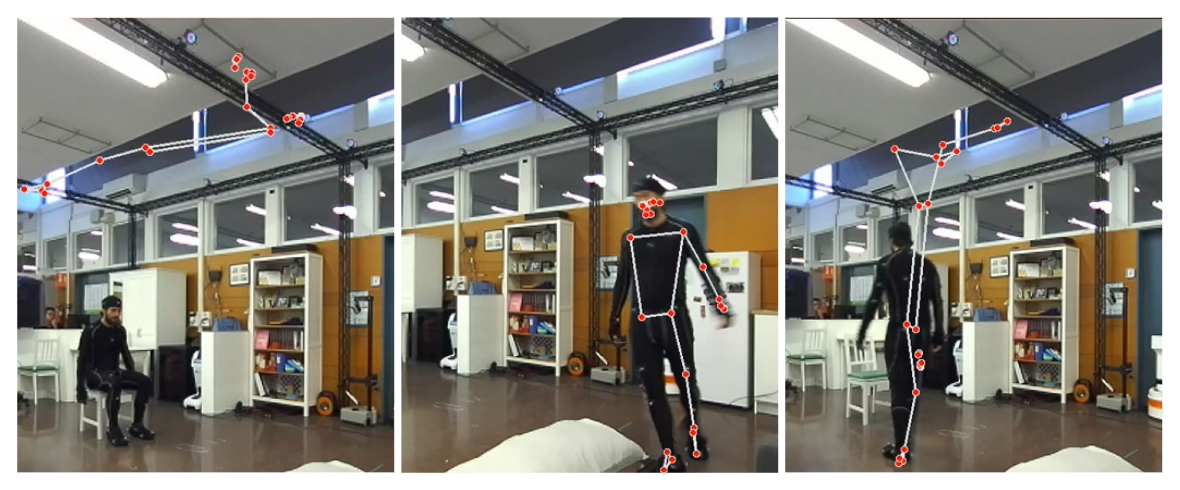
Examples of the skeleton tracked for each of the tests are shown below.
Gait Speed Test
TUG Test
5 Times Sit-Stand Test
Standing Balance Test - Feet together
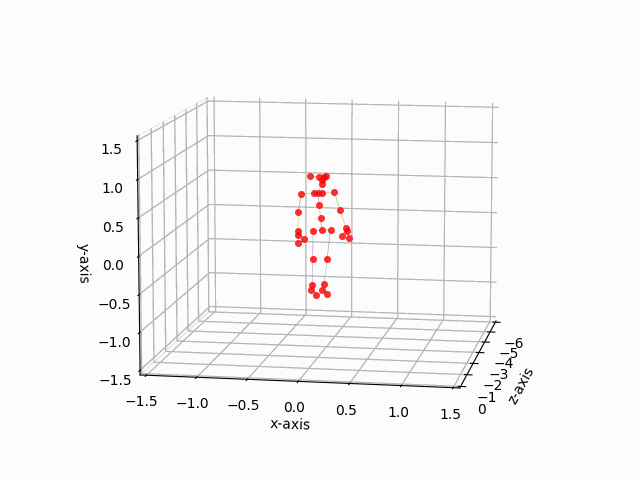
Standing Balance Test - Feet semi-tandem
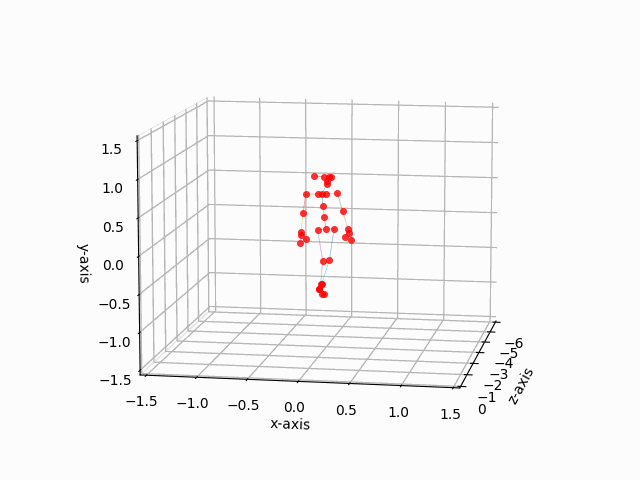
Standing Balance Test - Feet tandem
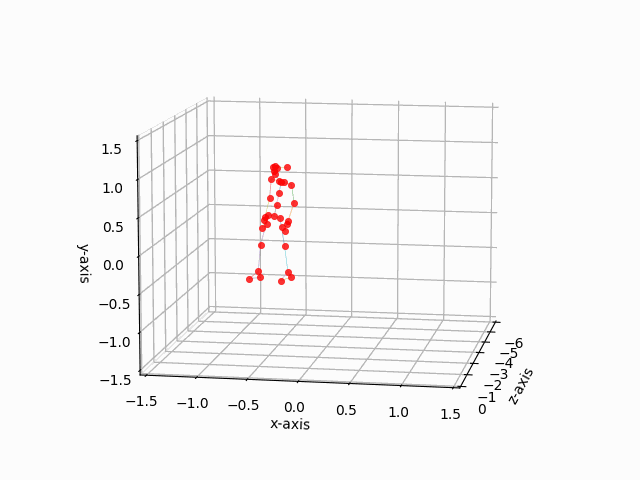
A distribution example for the tests is shown in Figure 1.
Tracking System Validation
To conduct this validation, 7 volunteers performed each of the tests three times wearing the OptiTrack suit with 41 markers. The skeleton 3D points were recorded using both ZED SDK and Mediapipe algorithms. The volunteers were asked to vary their behavior in each run of the tests to have more variance between the samples. The following results represent the metrics of the profitable runs where metrics could be acquired.
Mediapipe Results
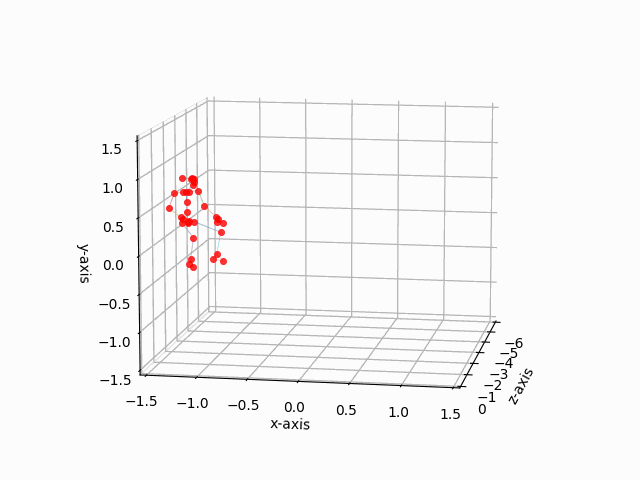
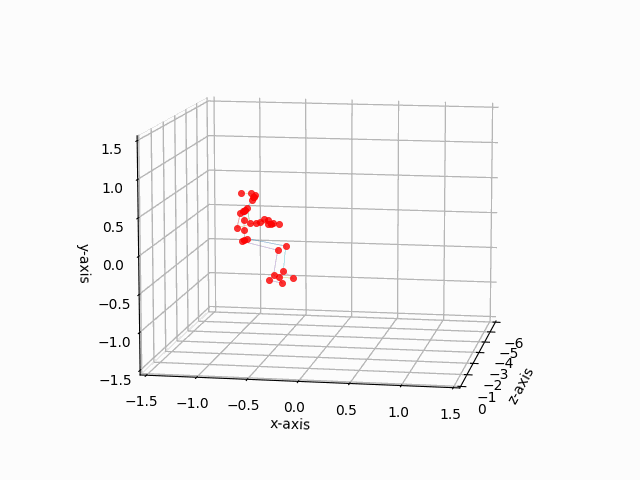
We tried to obtain the skeleton from an actual state of the art algorithm that is used in the literature. It is the case of the Mediapipe, which showed bad tracking results at a certain distance (>5 meters). We show a picture of the output of the Mediapipe algorithm in a recording of the TUG test during the experiments with the OptiTrack.
ZED SDK Results
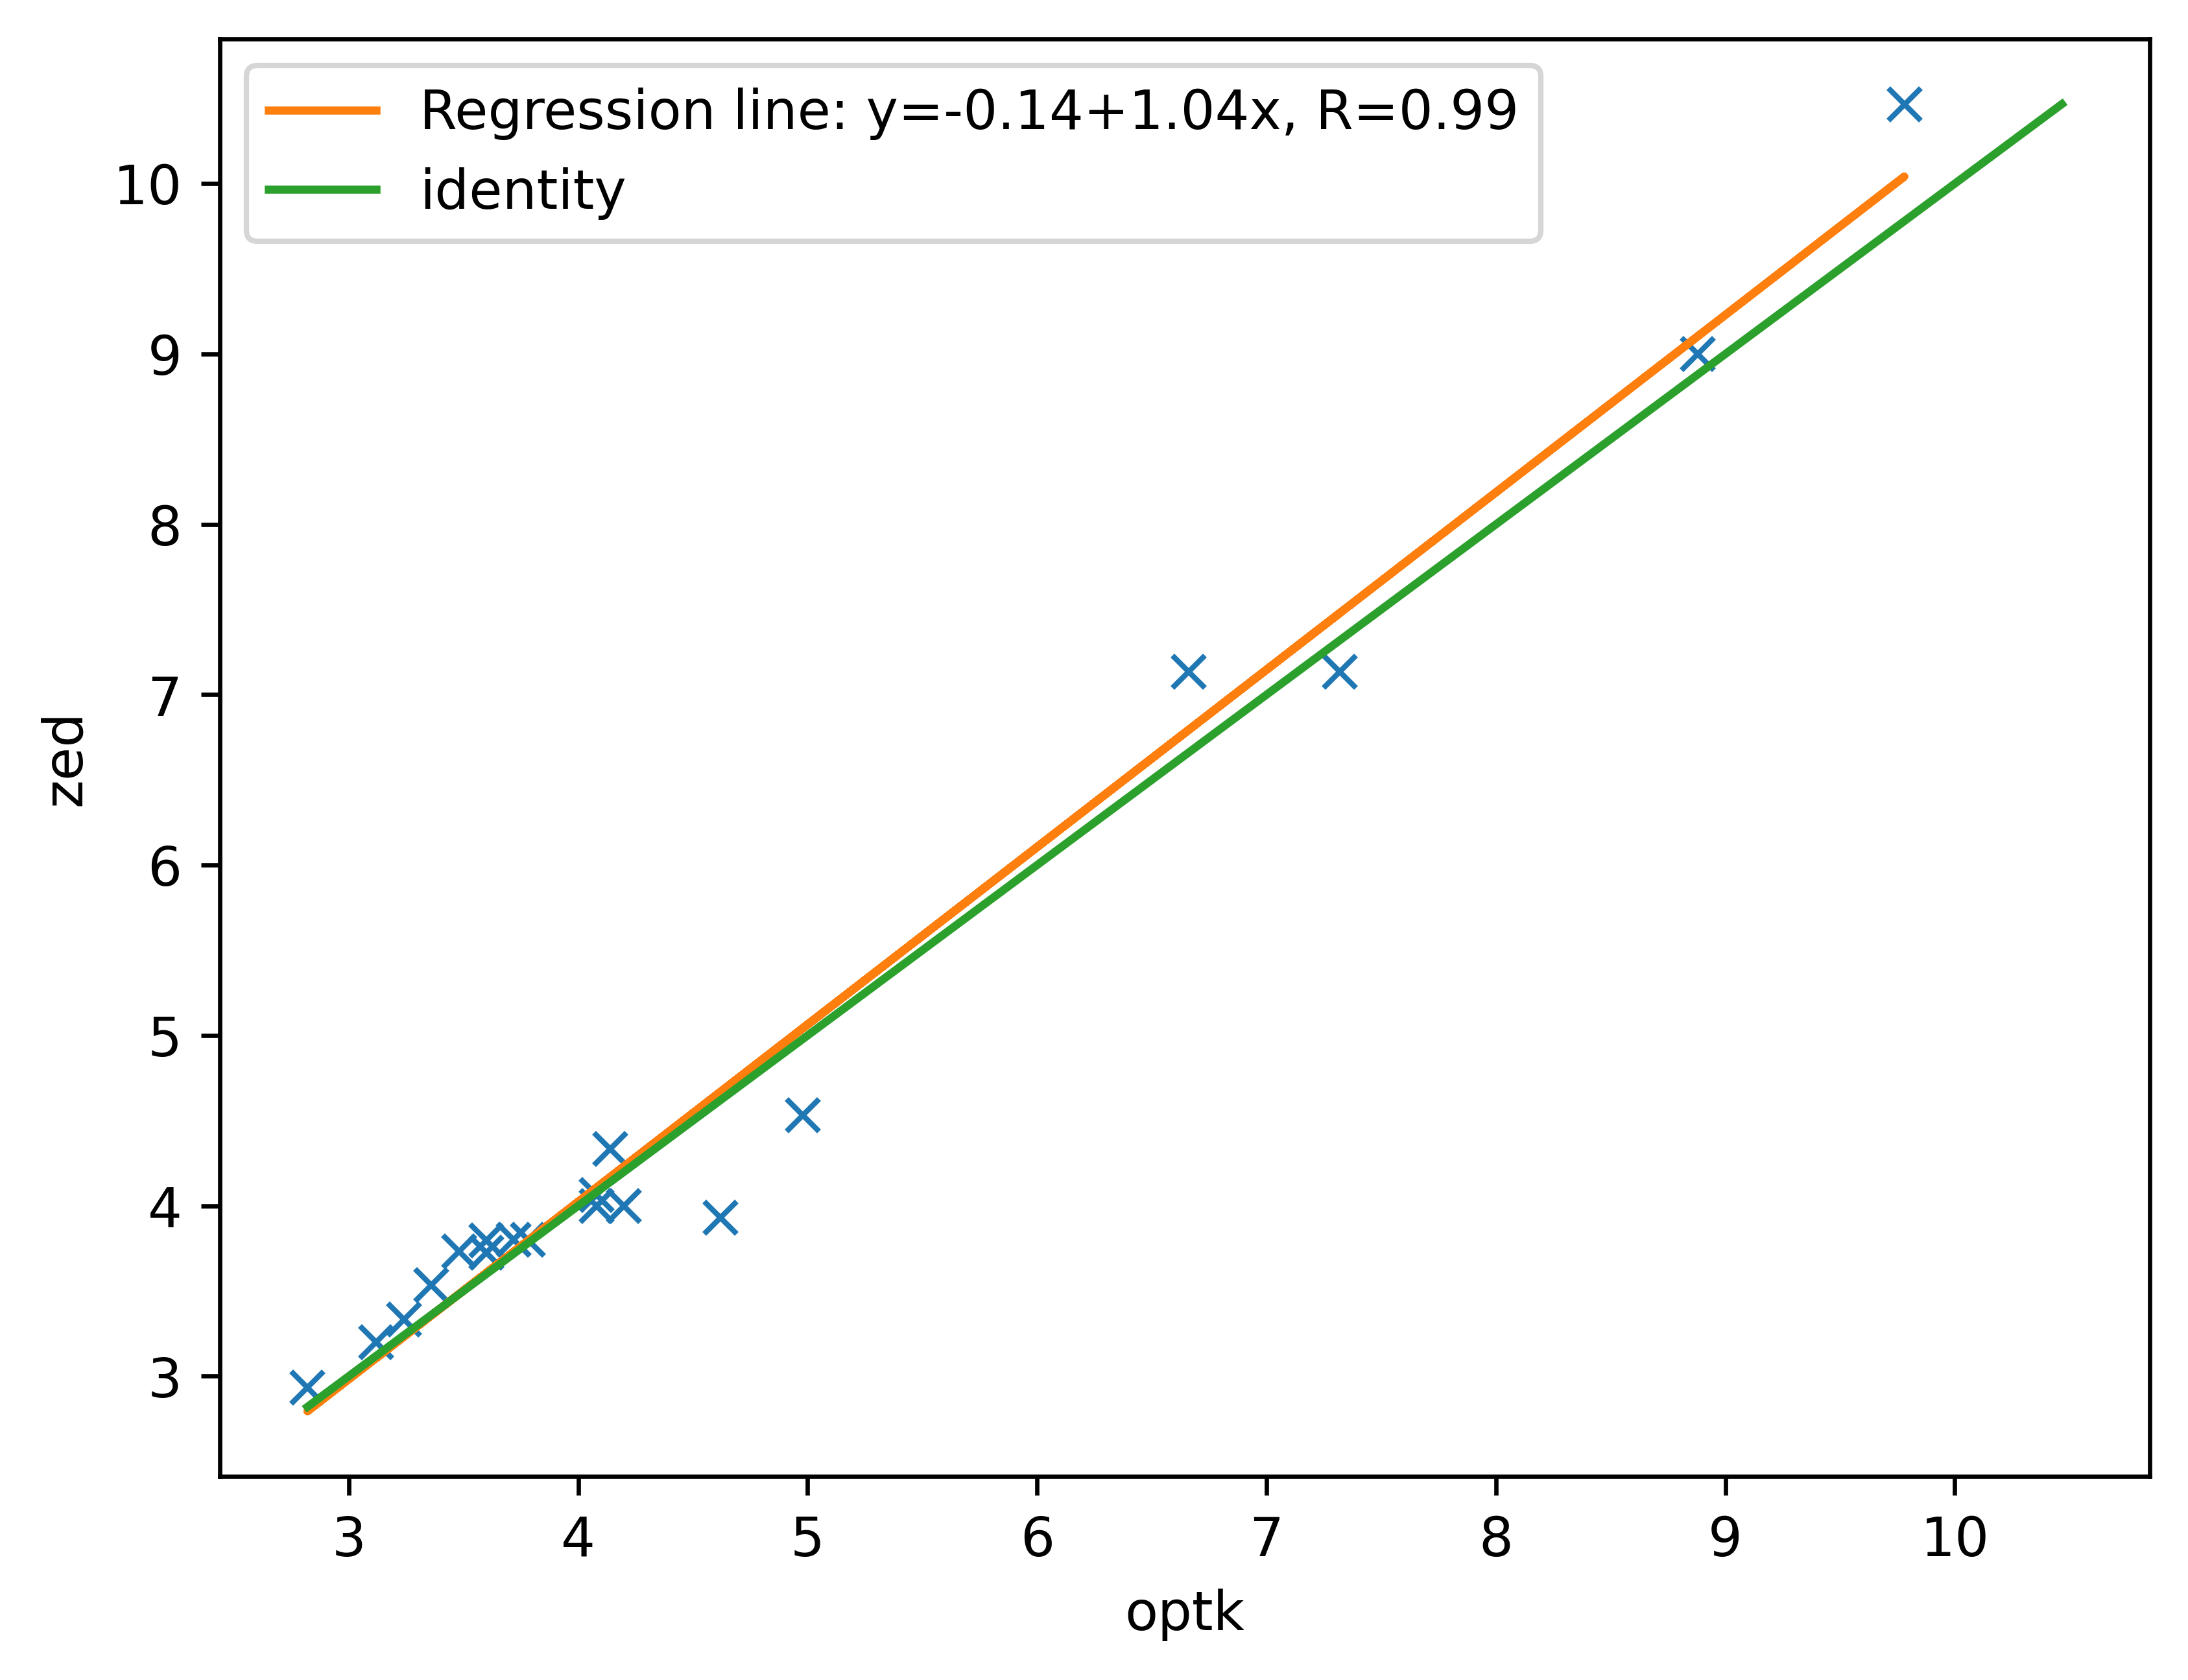
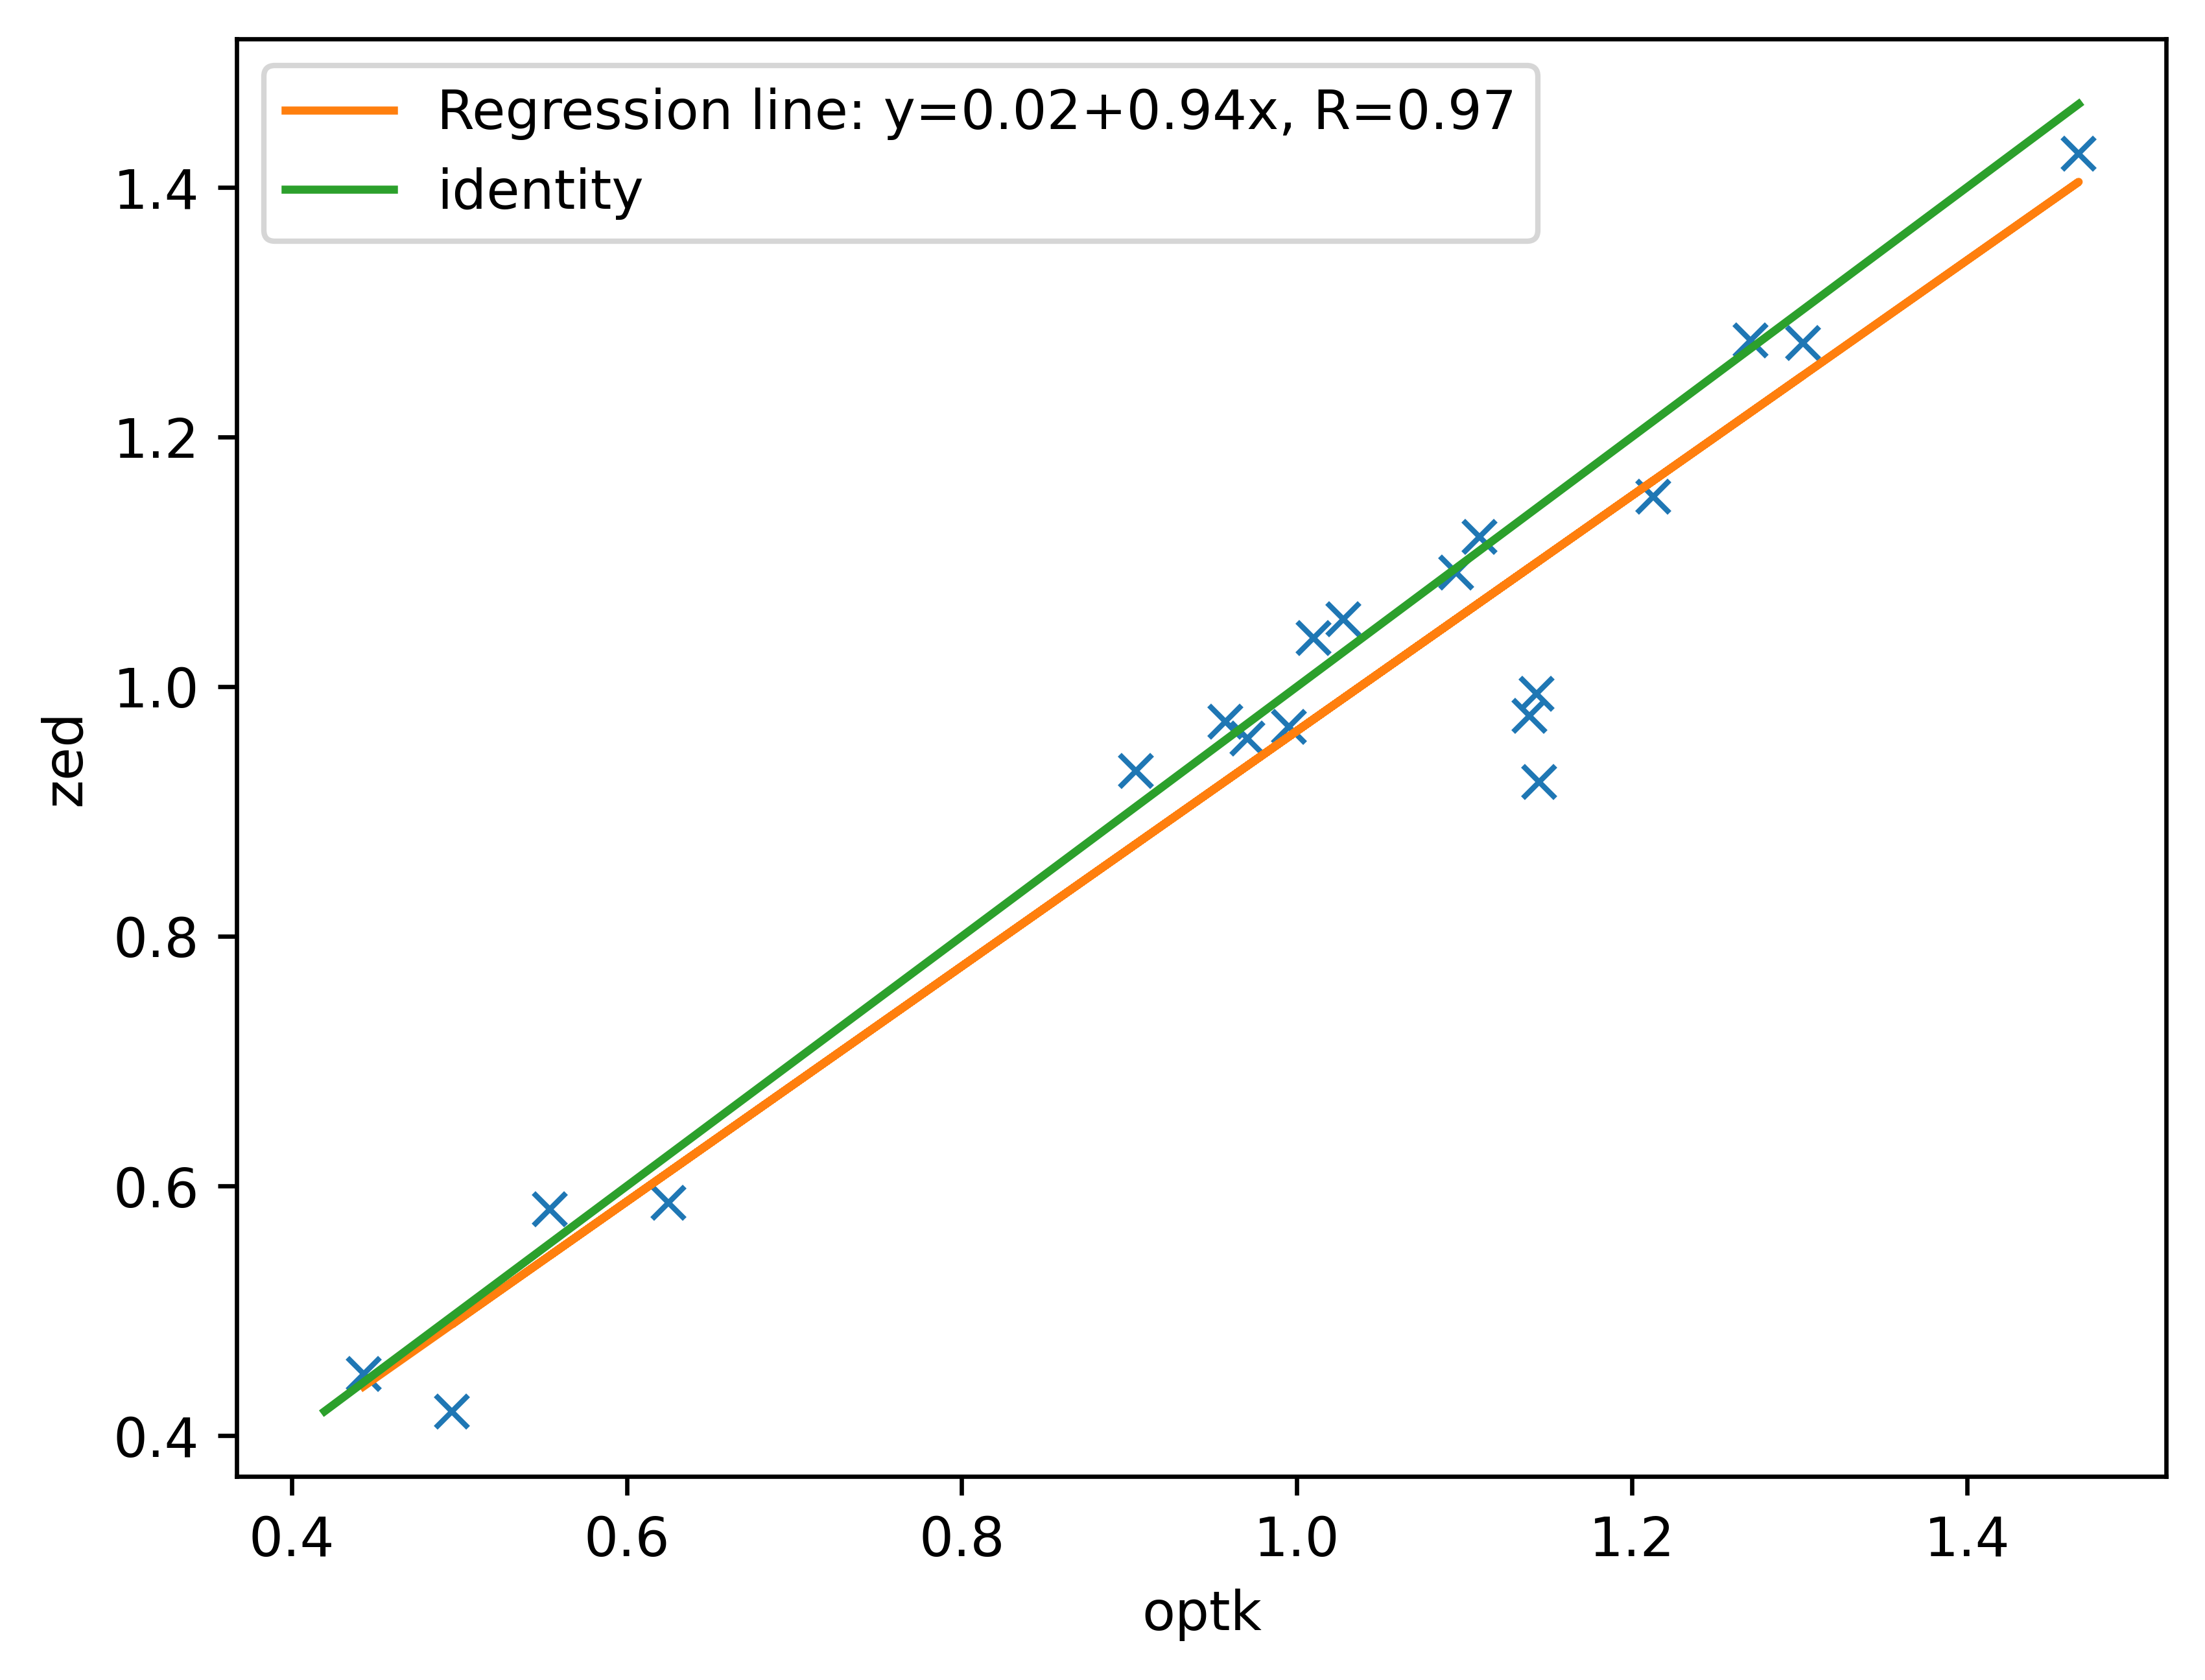
Here, the obtained metrics from the tests, captured with the ZED2i camera using its SDK, are validated using the OptiTrack system as a ground truth. The following table contains the means of each metric, both from the OptiTrack and our system. Also the Mean Absolute Percentage Error (MAPE) is shown.| Test | Metric | Optitrack (M) | Our System (M) | MAPE (%) |
|---|---|---|---|---|
| Gait Speed | Time (s) | 4.71 | 4.76 | 4.73 |
| Gait Speed | Left Stride Length (m) | 1.25 | 1.16 | 8.41 |
| Gait Speed | Left Stride Velocity (m/s) | 0.99 | 0.96 | 5.12 |
| Gait Speed | Left Step Length (m) | 0.67 | 0.52 | 22.26 |
| Gait Speed | Left Step Velocity (m/s) | 1.07 | 0.93 | 15.49 |
| Gait Speed | Left Step Width (m) | 0.22 | 0.13 | 38.79 |
| Gait Speed | Right Stride Length (m) | 1.24 | 1.13 | 9.53 |
| Gait Speed | Right Stride Velocity (m/s) | 0.99 | 0.97 | 5.34 |
| Gait Speed | Right Step Length (m) | 0.66 | 0.67 | 12.26 |
| Gait Speed | Right Step Velocity (m/s) | 1.05 | 1.09 | 11.32 |
| Gait Speed | Right Step Width (m) | 0.21 | 0.14 | 34.48 |
| Gait Speed | Range Balance (m) | 0.05 | 0.08 | 68.74 |
| Gait Speed | Mean Balance (m) | 0.03 | 0.04 | 66.02 |
| Gait Speed | Number Steps | 7.11 | 7.68 | 11.11 |
| TUG | Time (s) | 9.29 | 9.36 | 2.03 |
| TUG | Left Stride Length (m) | 1.11 | 1 | 12.41 |
| TUG | Left Stride Velocity (m/s) | 0.86 | 0.81 | 9.5 |
| TUG | Left Step Length (m) | 0.59 | 0.56 | 13.09 |
| TUG | Left Step Velocity (m/s) | 0.92 | 0.91 | 9.73 |
| TUG | Left Step Width (m) | 0.19 | 0.14 | 33.28 |
| TUG | Right Stride Length (m) | 1.06 | 1.02 | 9.27 |
| TUG | Right Stride Velocity (m/s) | 0.82 | 0.79 | 6.52 |
| TUG | Right Step Length (m) | 0.59 | 0.52 | 13.54 |
| TUG | Right Step Velocity (m/s) | 0.94 | 0.8 | 15.41 |
| TUG | Right Step Width (m) | 0.24 | 0.17 | 31.61 |
| TUG | Range Balance (m) | 0.57 | 0.48 | 17.47 |
| TUG | Mean Balance (m) | 0.42 | 0.33 | 20.55 |
| TUG | Number Steps | 14 | 13.78 | 9.52 |
| Standing Balance | Time Together (s) | 10 | 10 | 0 |
| Standing Balance | Time Semi-Tandem (s) | 10 | 10 | 0 |
| Standing Balance | Time Tandem (s) | 10 | 10 | 0 |
| Standing Balance | Box Together (m3) | 0.0021 | 0.0019 | 14.98 |
| Standing Balance | Box Semi-Tandem (m3) | 0.0001 | 0.0002 | 69.51 |
| Standing Balance | Box Tandem (m3) | 0.0011 | 0.0008 | 33.87 |
| 5 Times Sit-Stand | Time (s) | 21.83 | 22.04 | 1.2 |
| 5 Times Sit-Stand | Fatigue (s) | 1.55 | 1.29 | 24.91 |
| 5 Times Sit-Stand | Number Sequences | 5 | 5 | 0 |
Validation Results
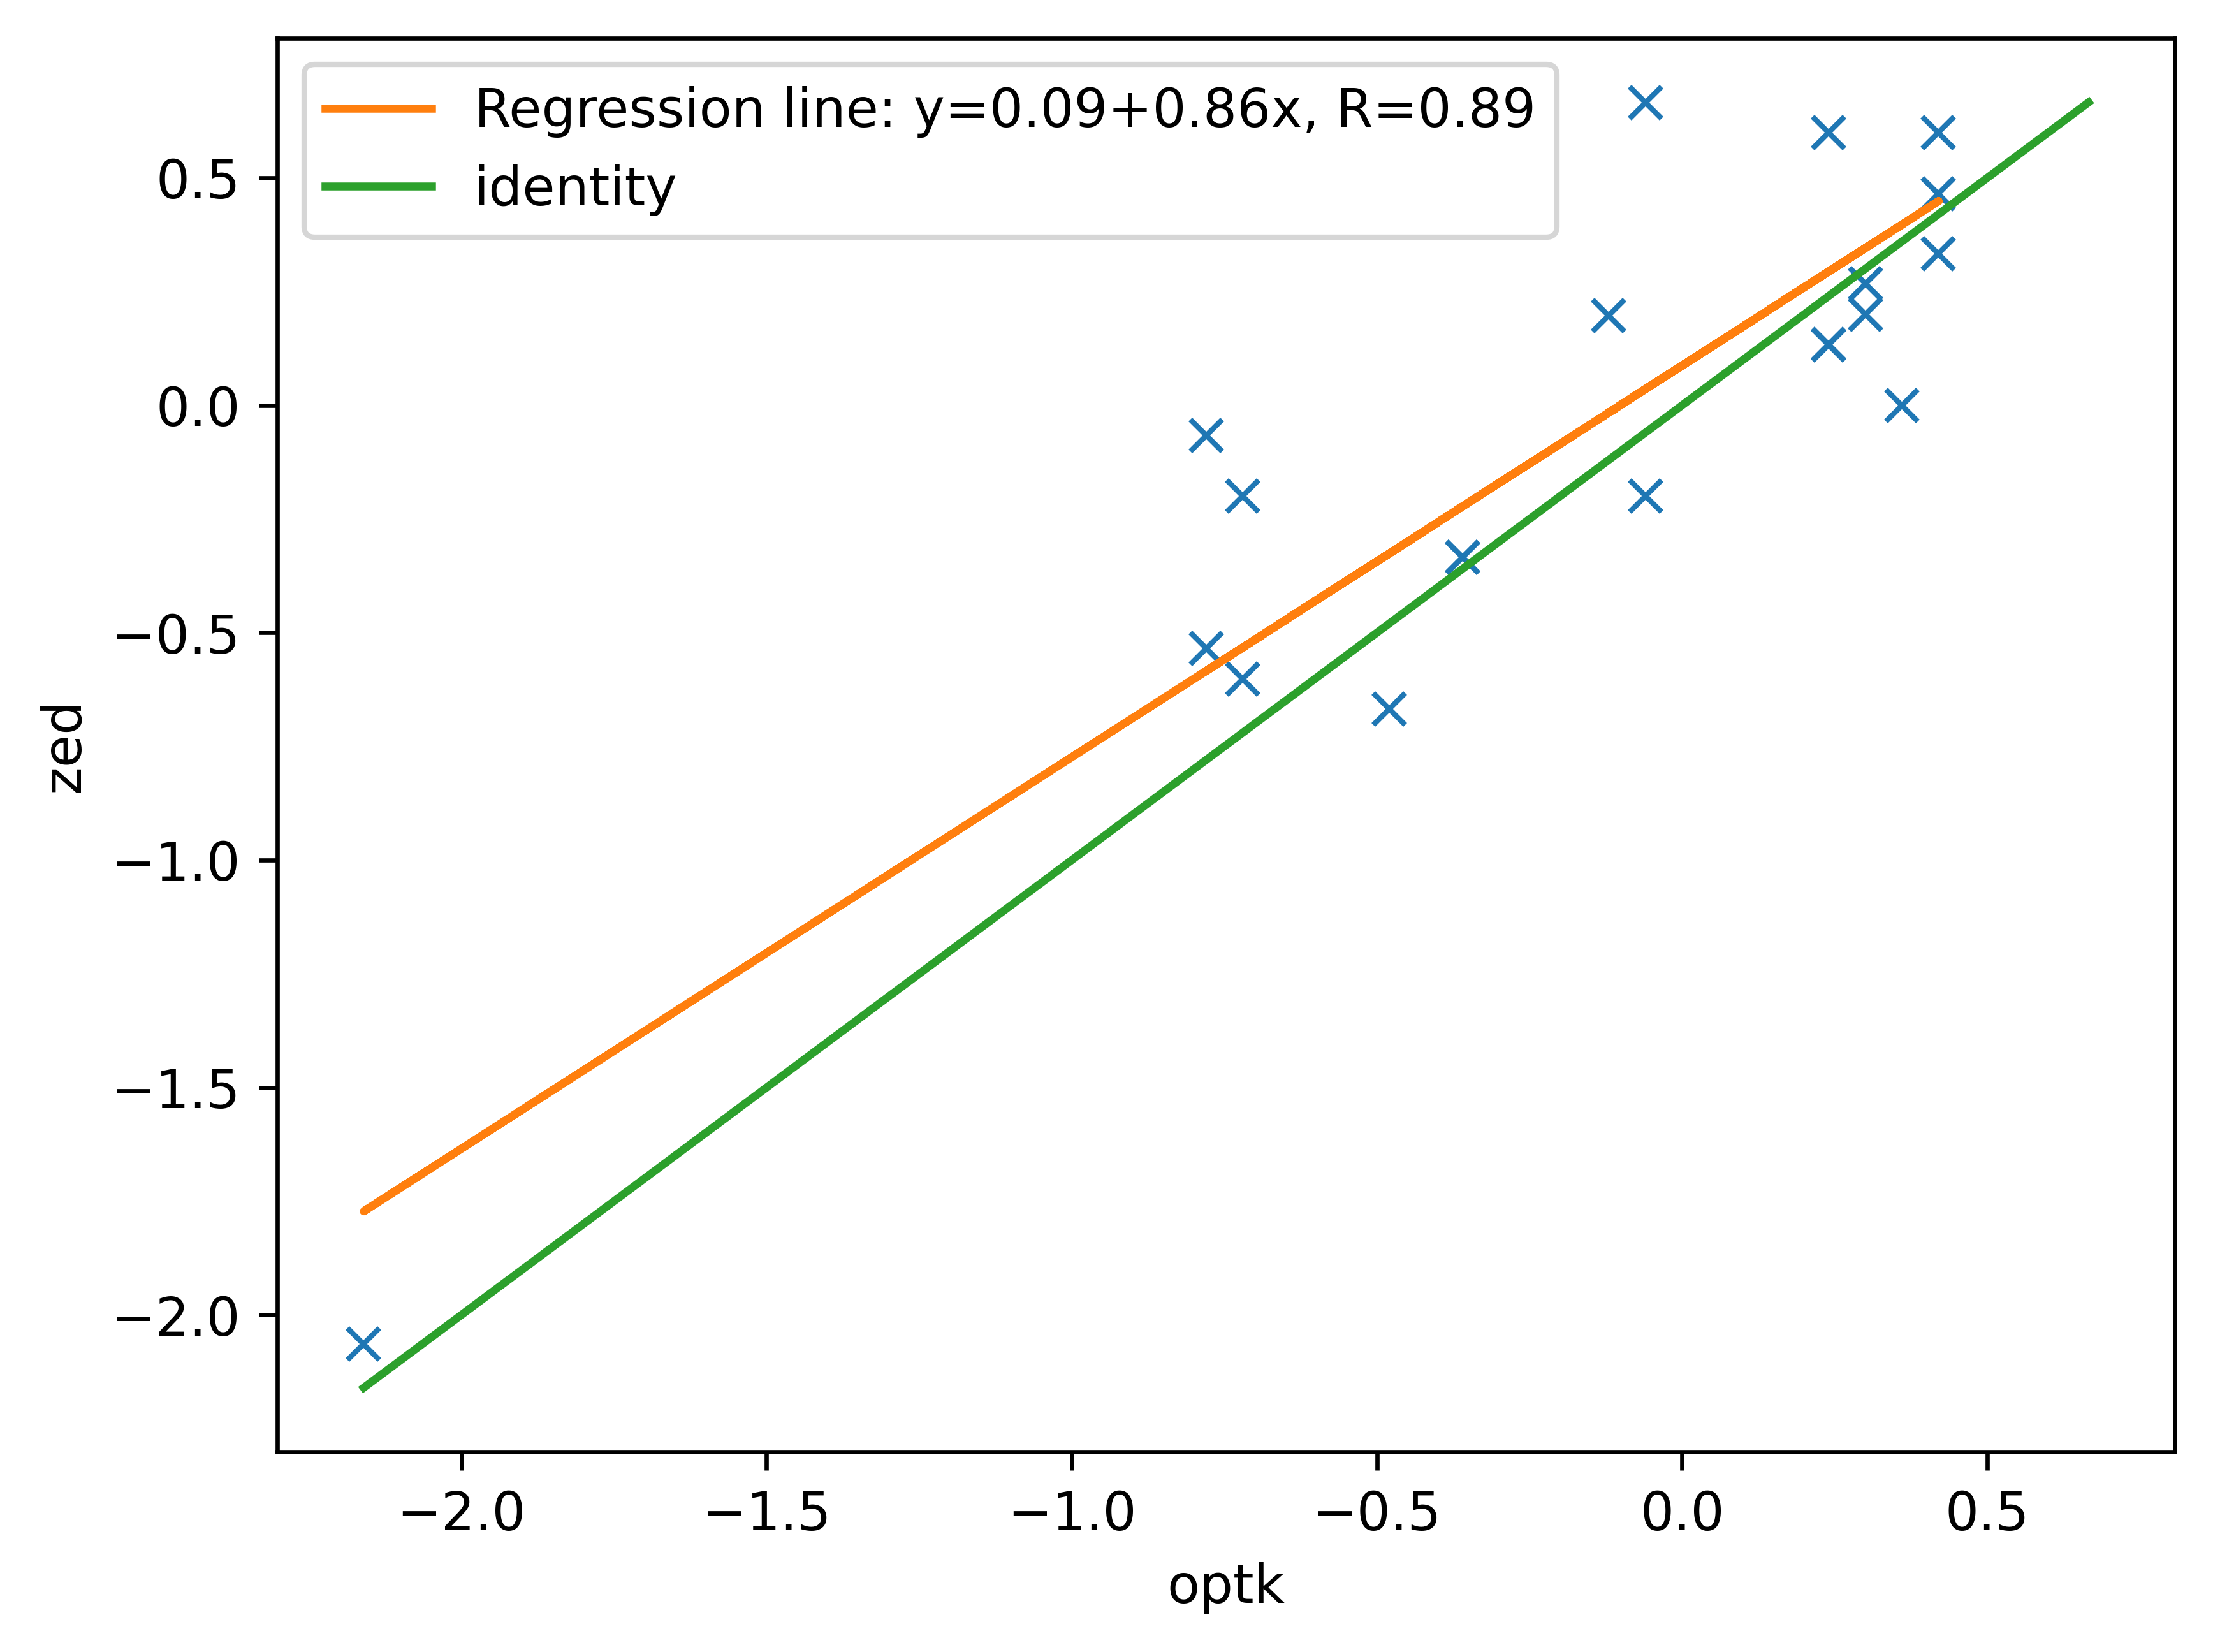
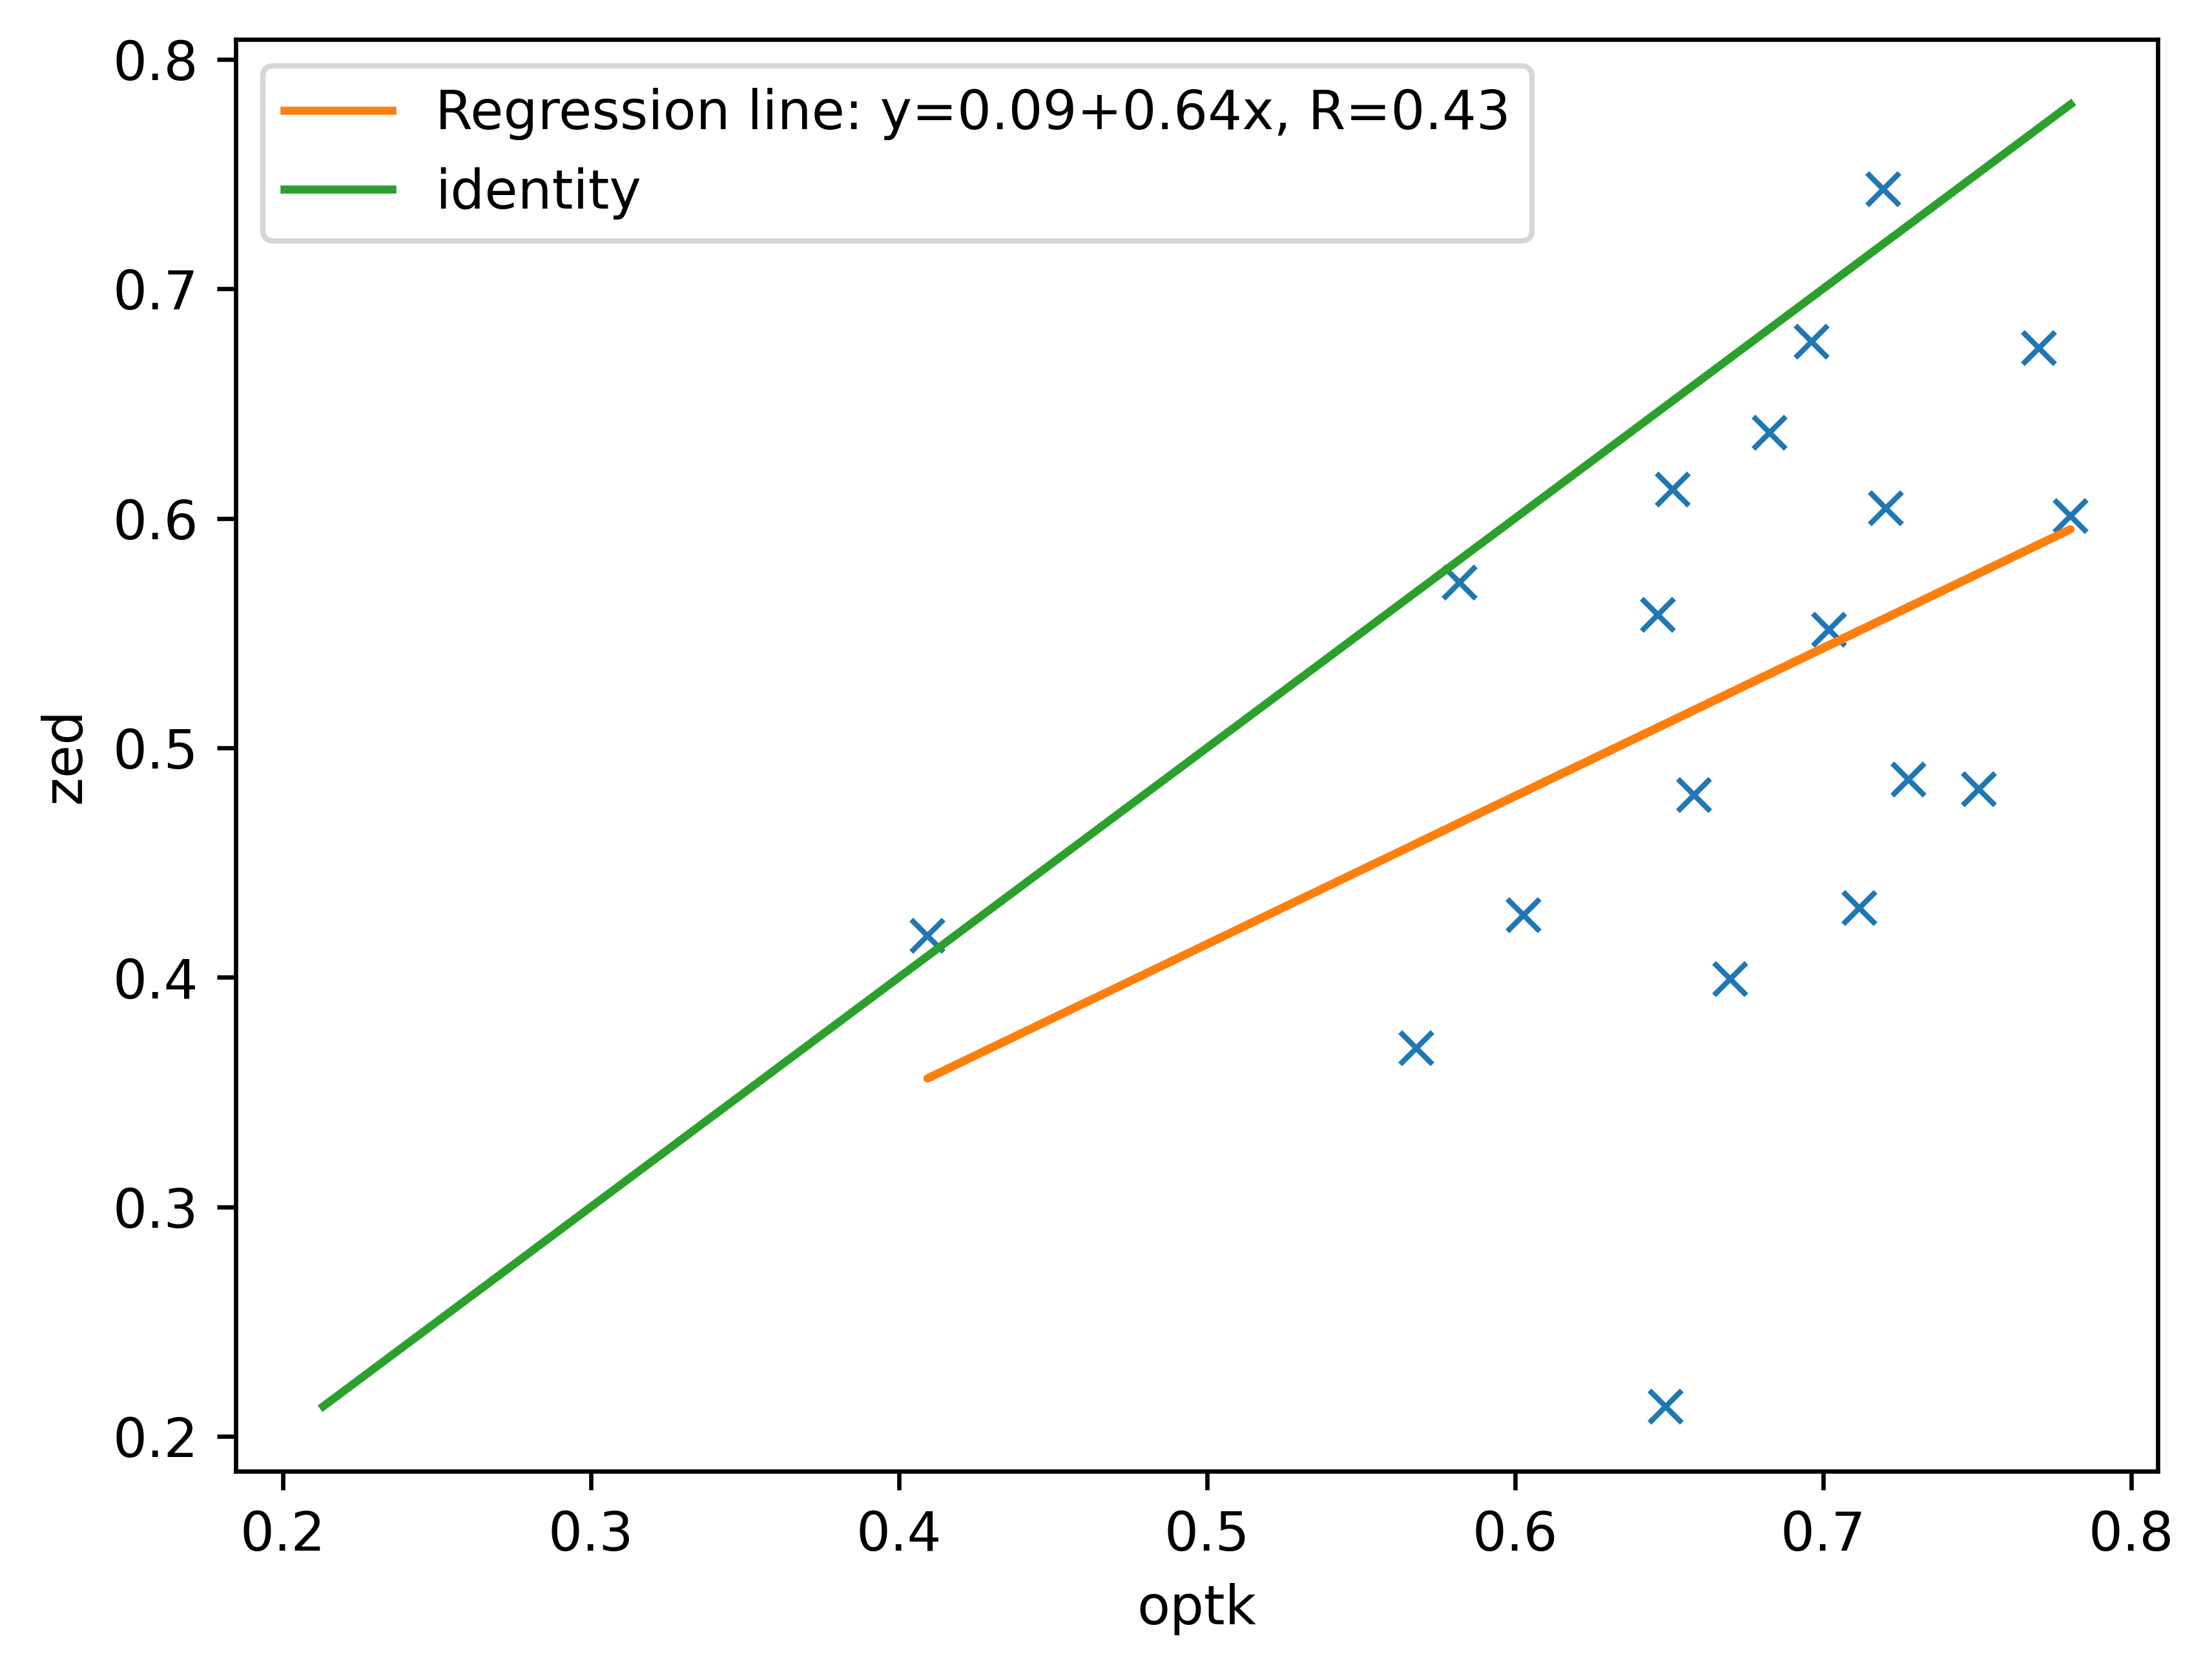
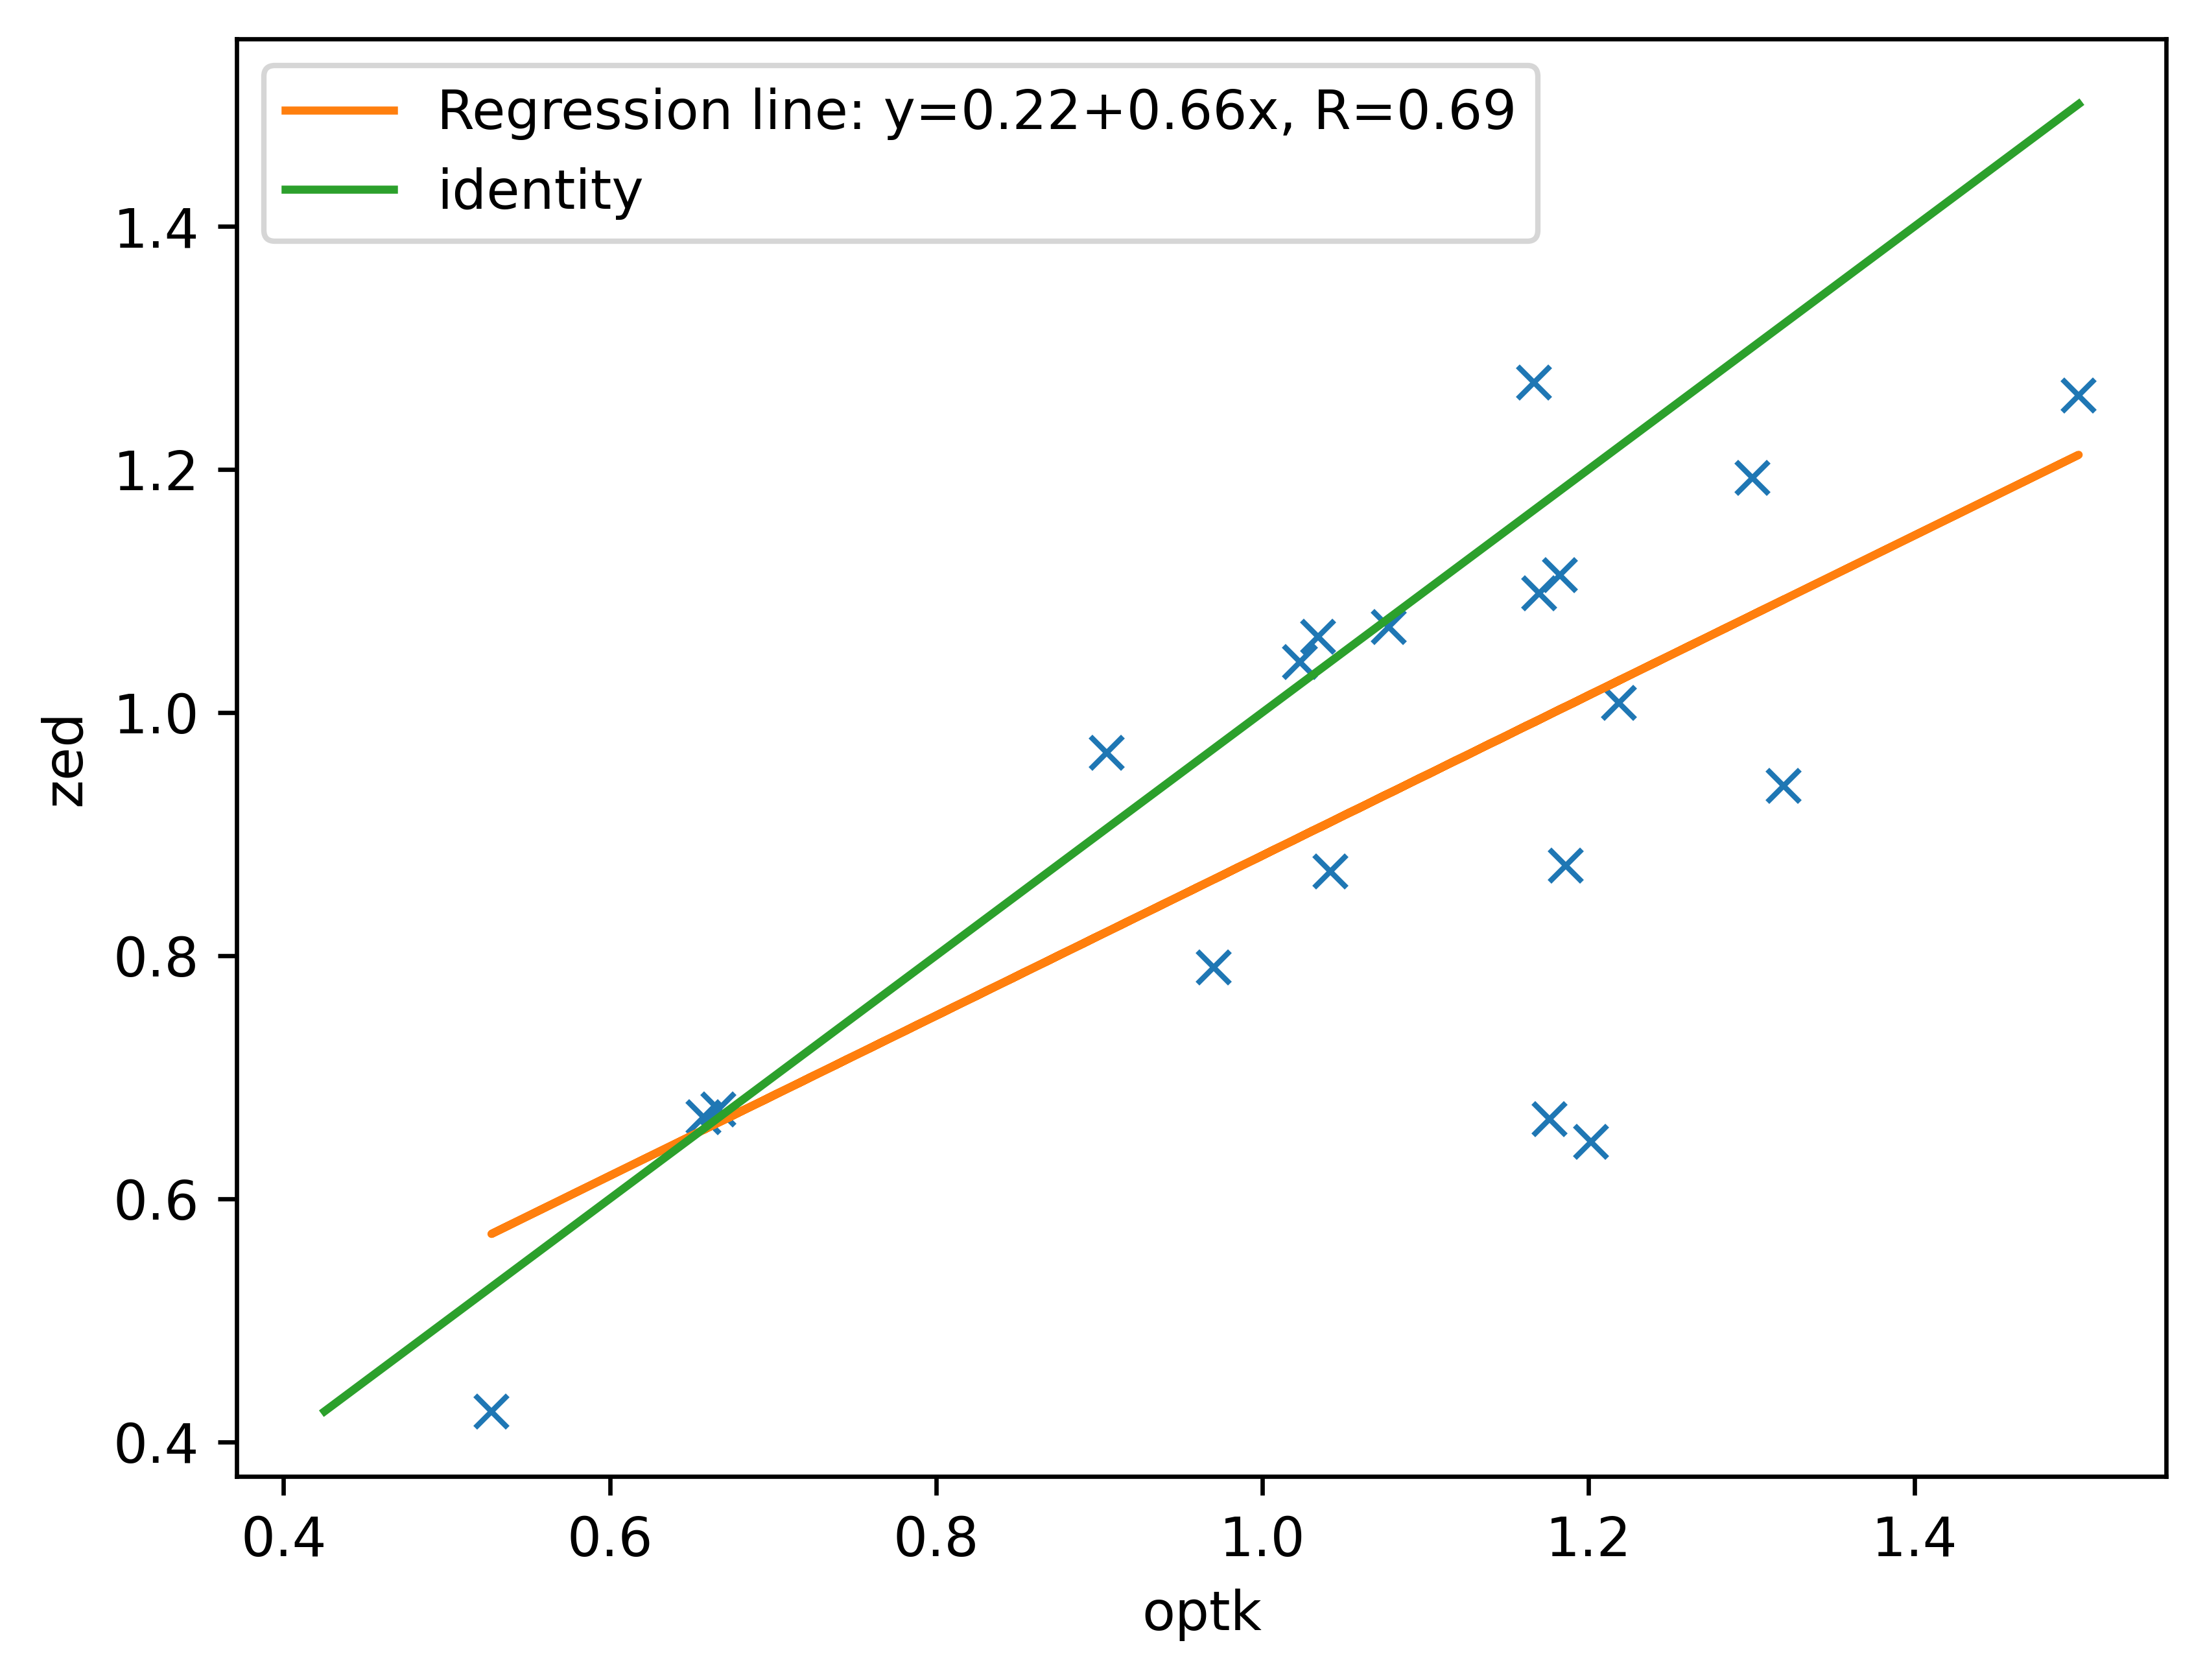
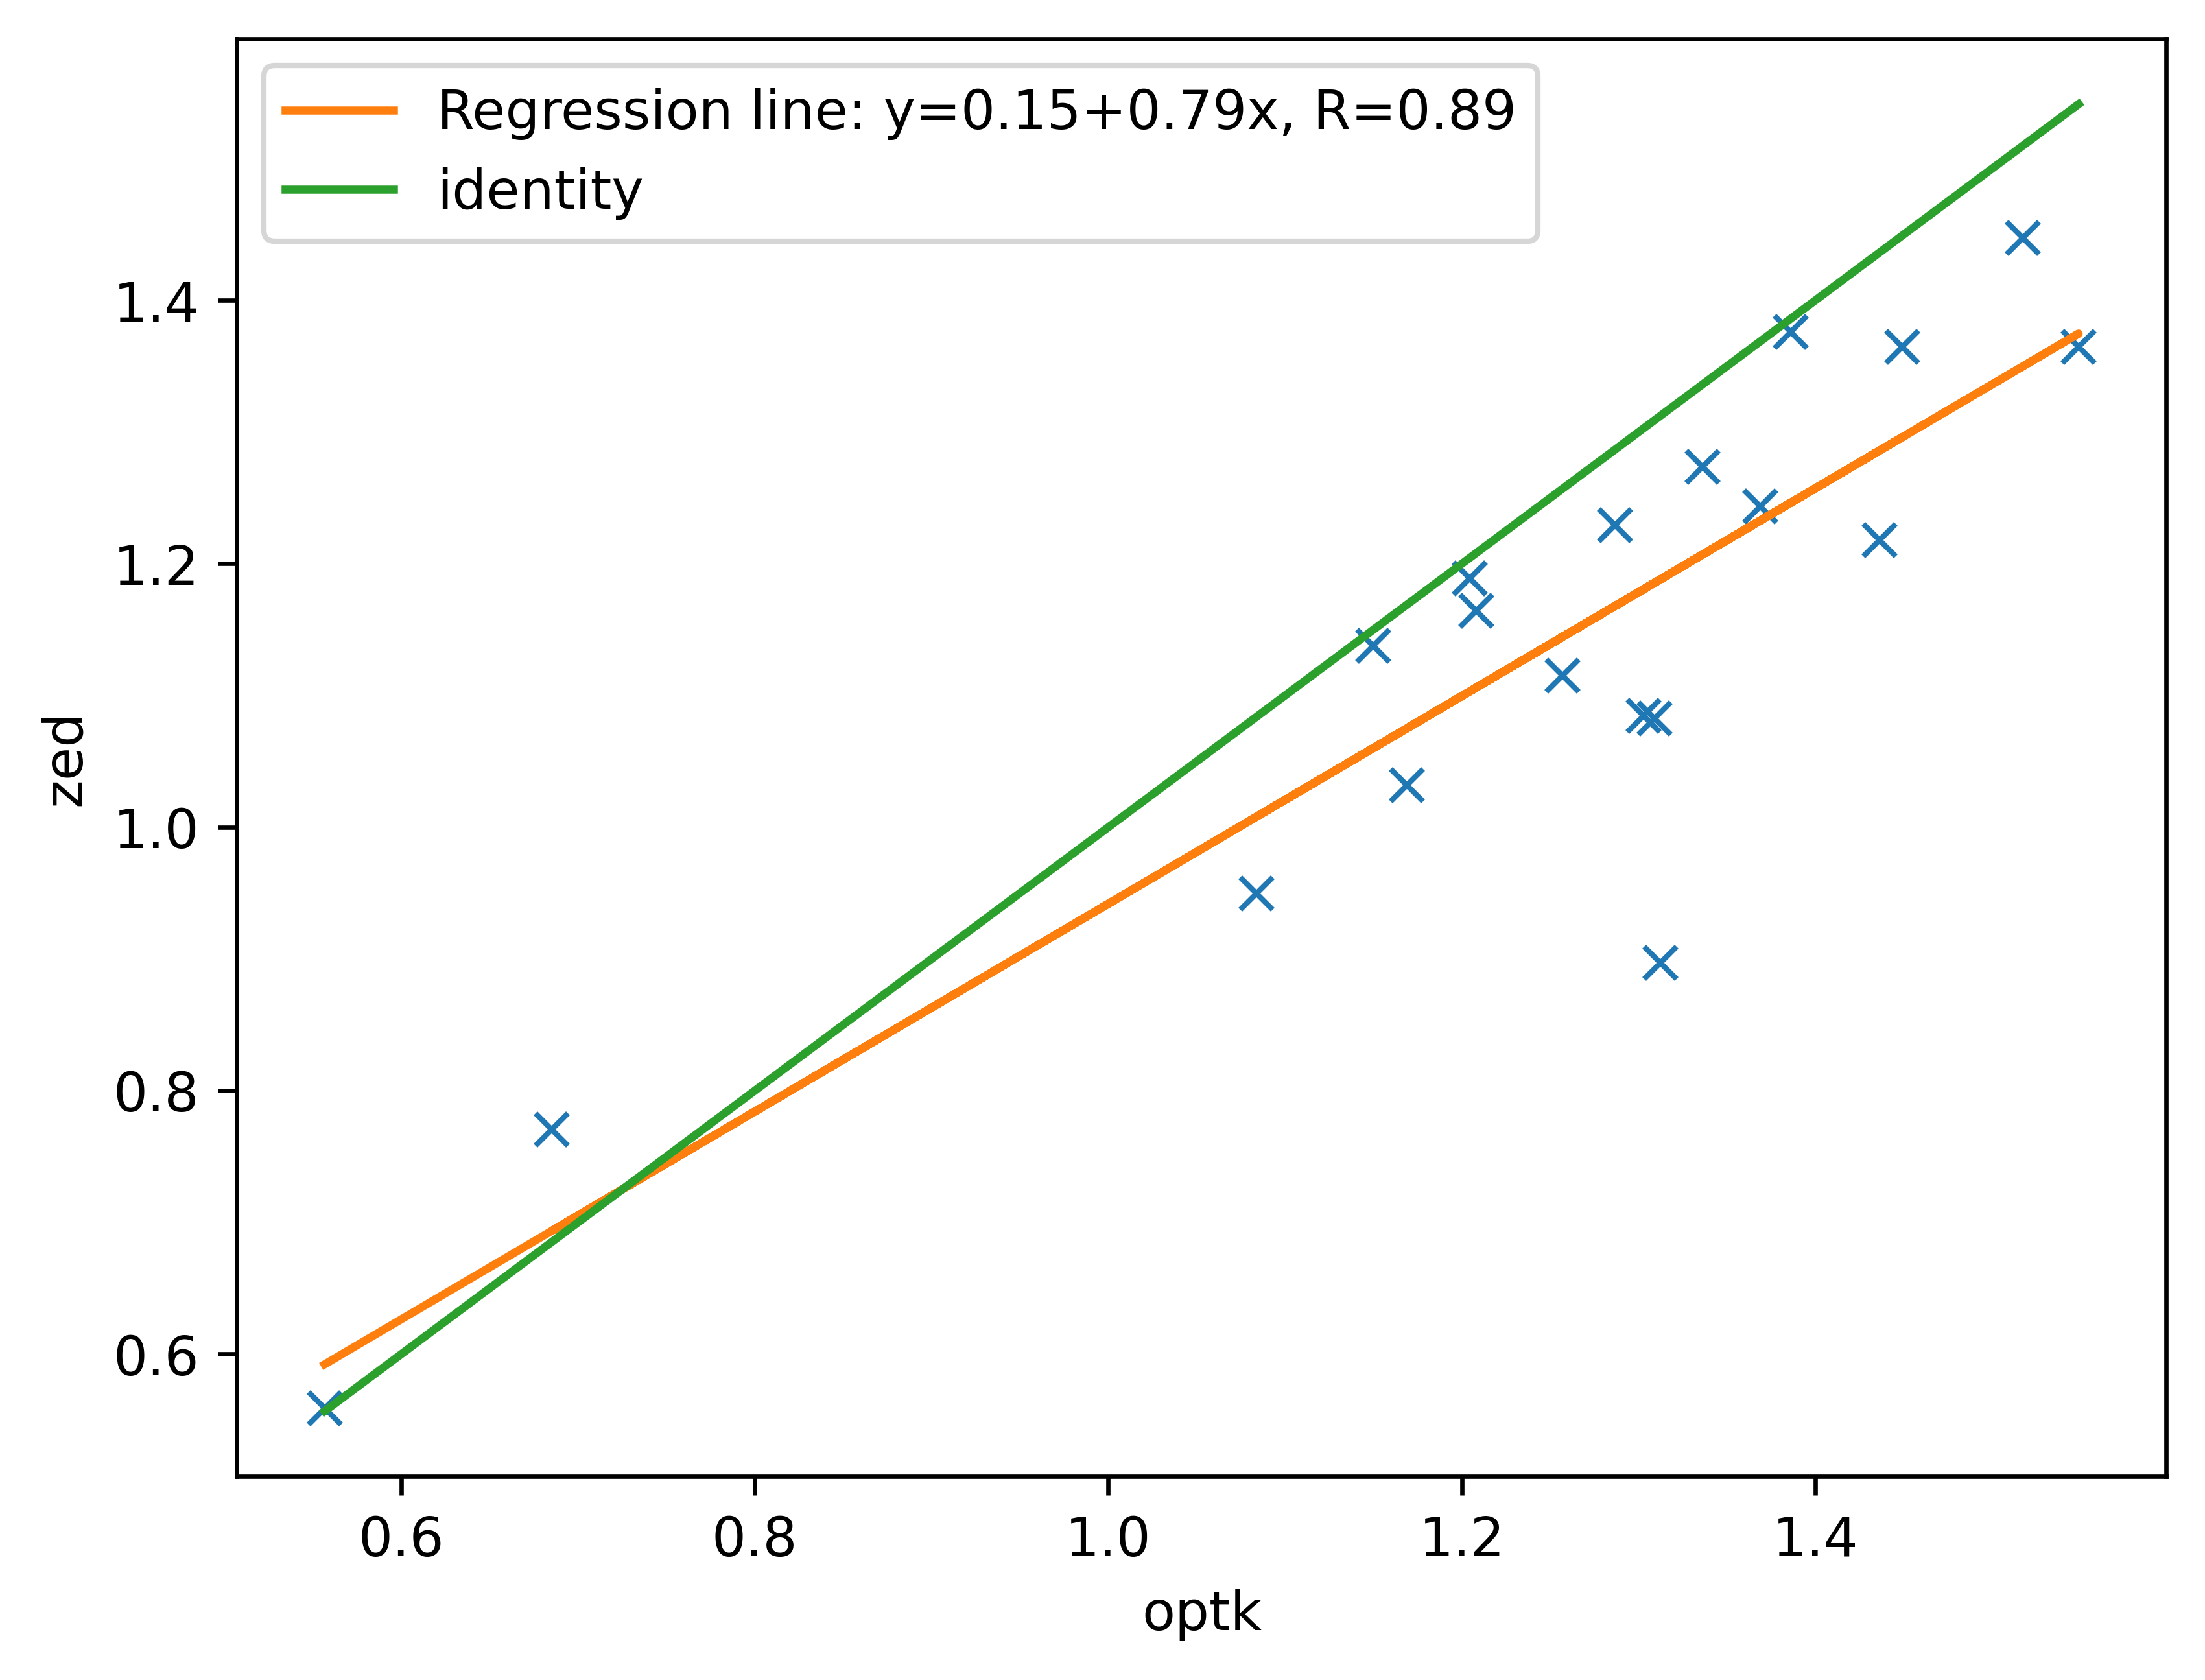
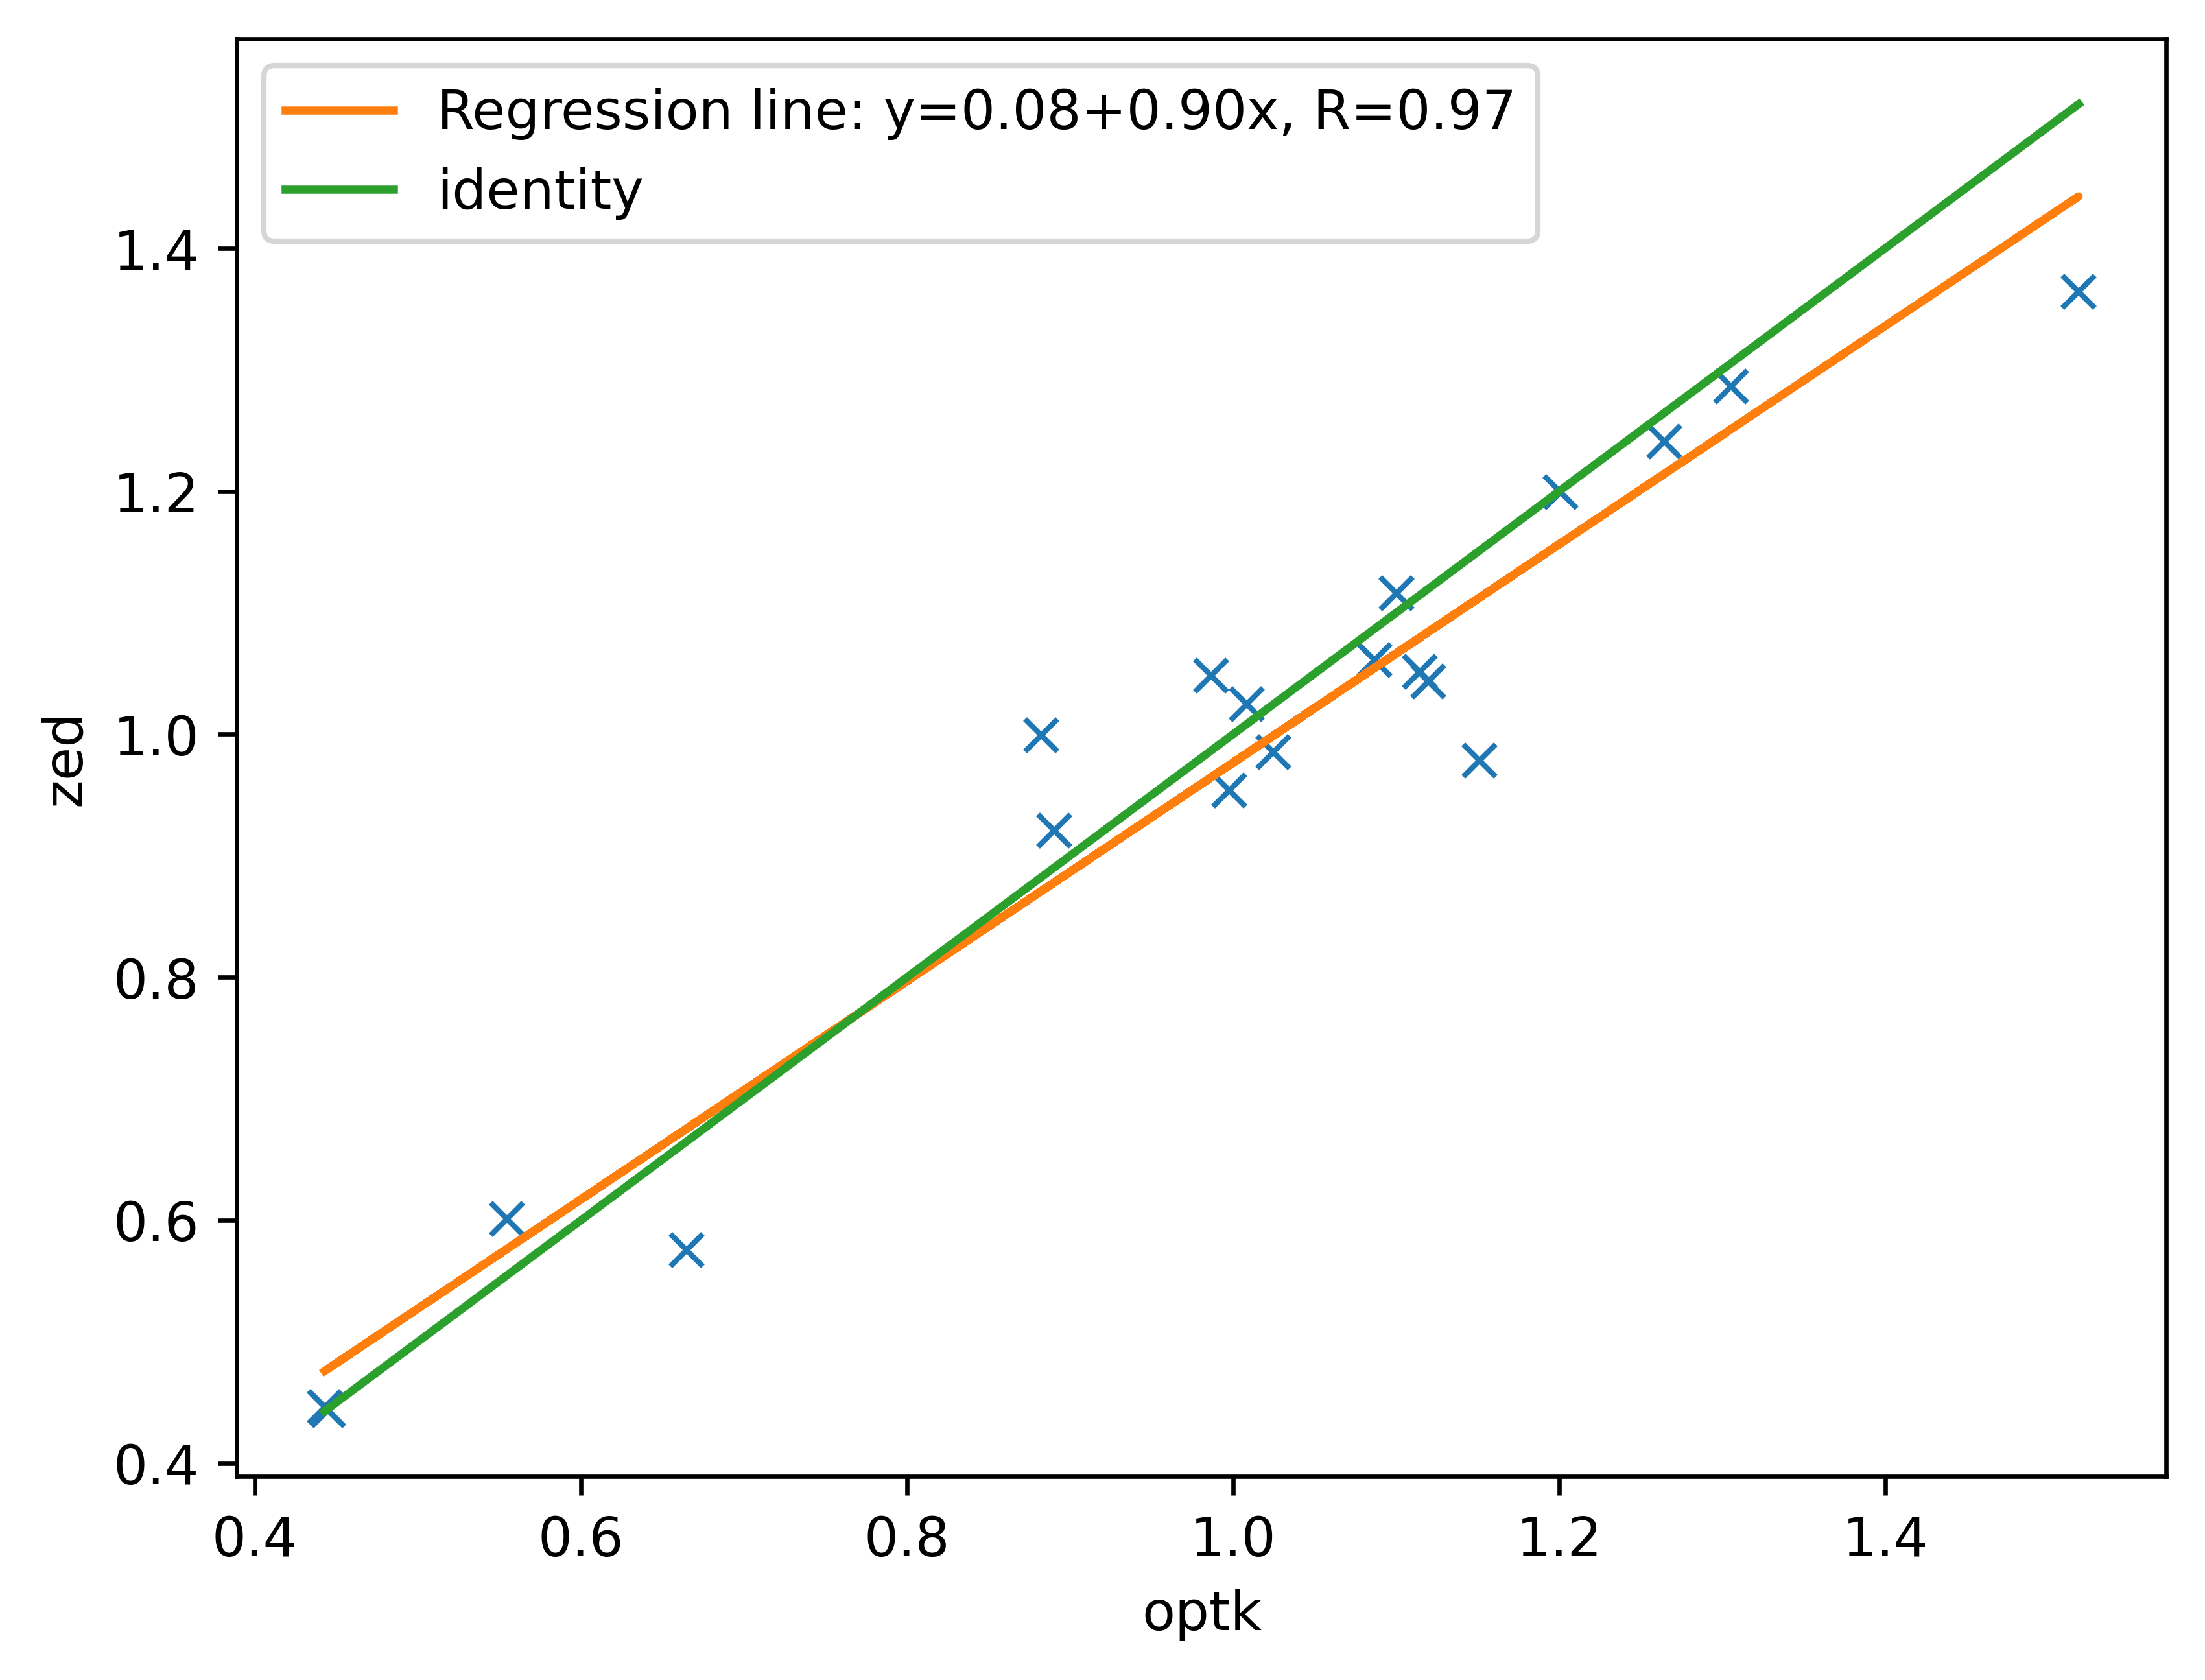
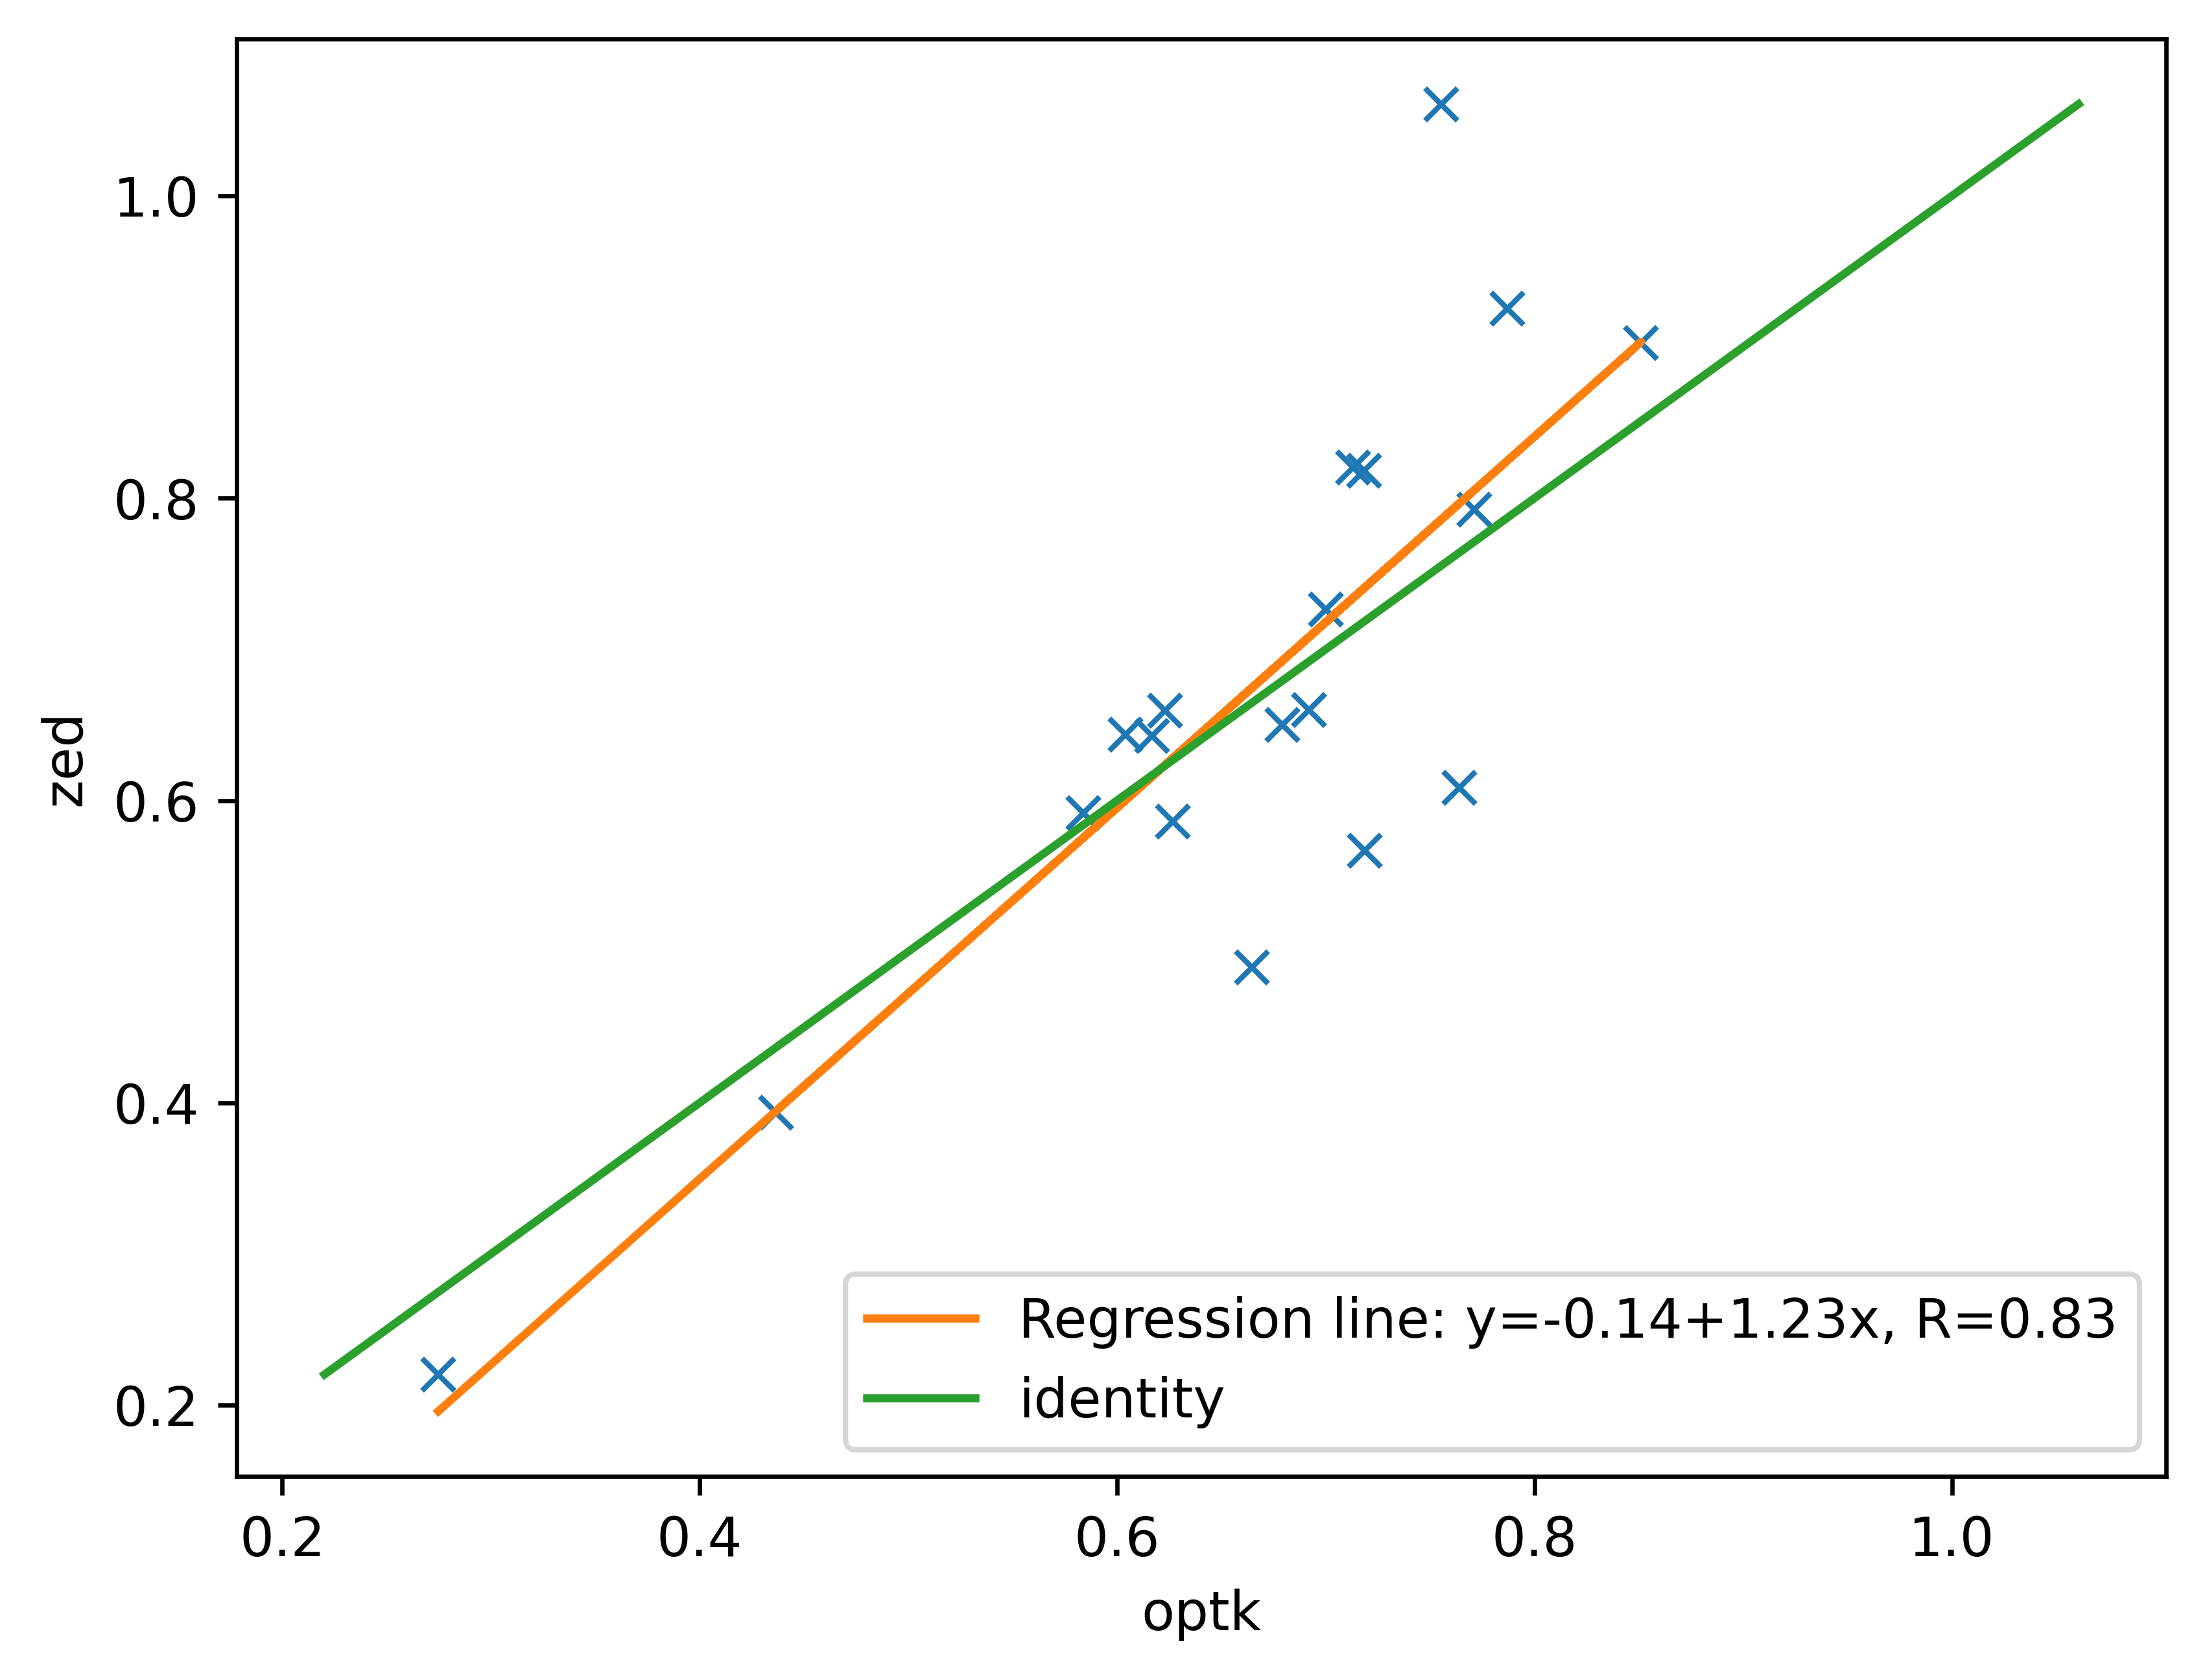
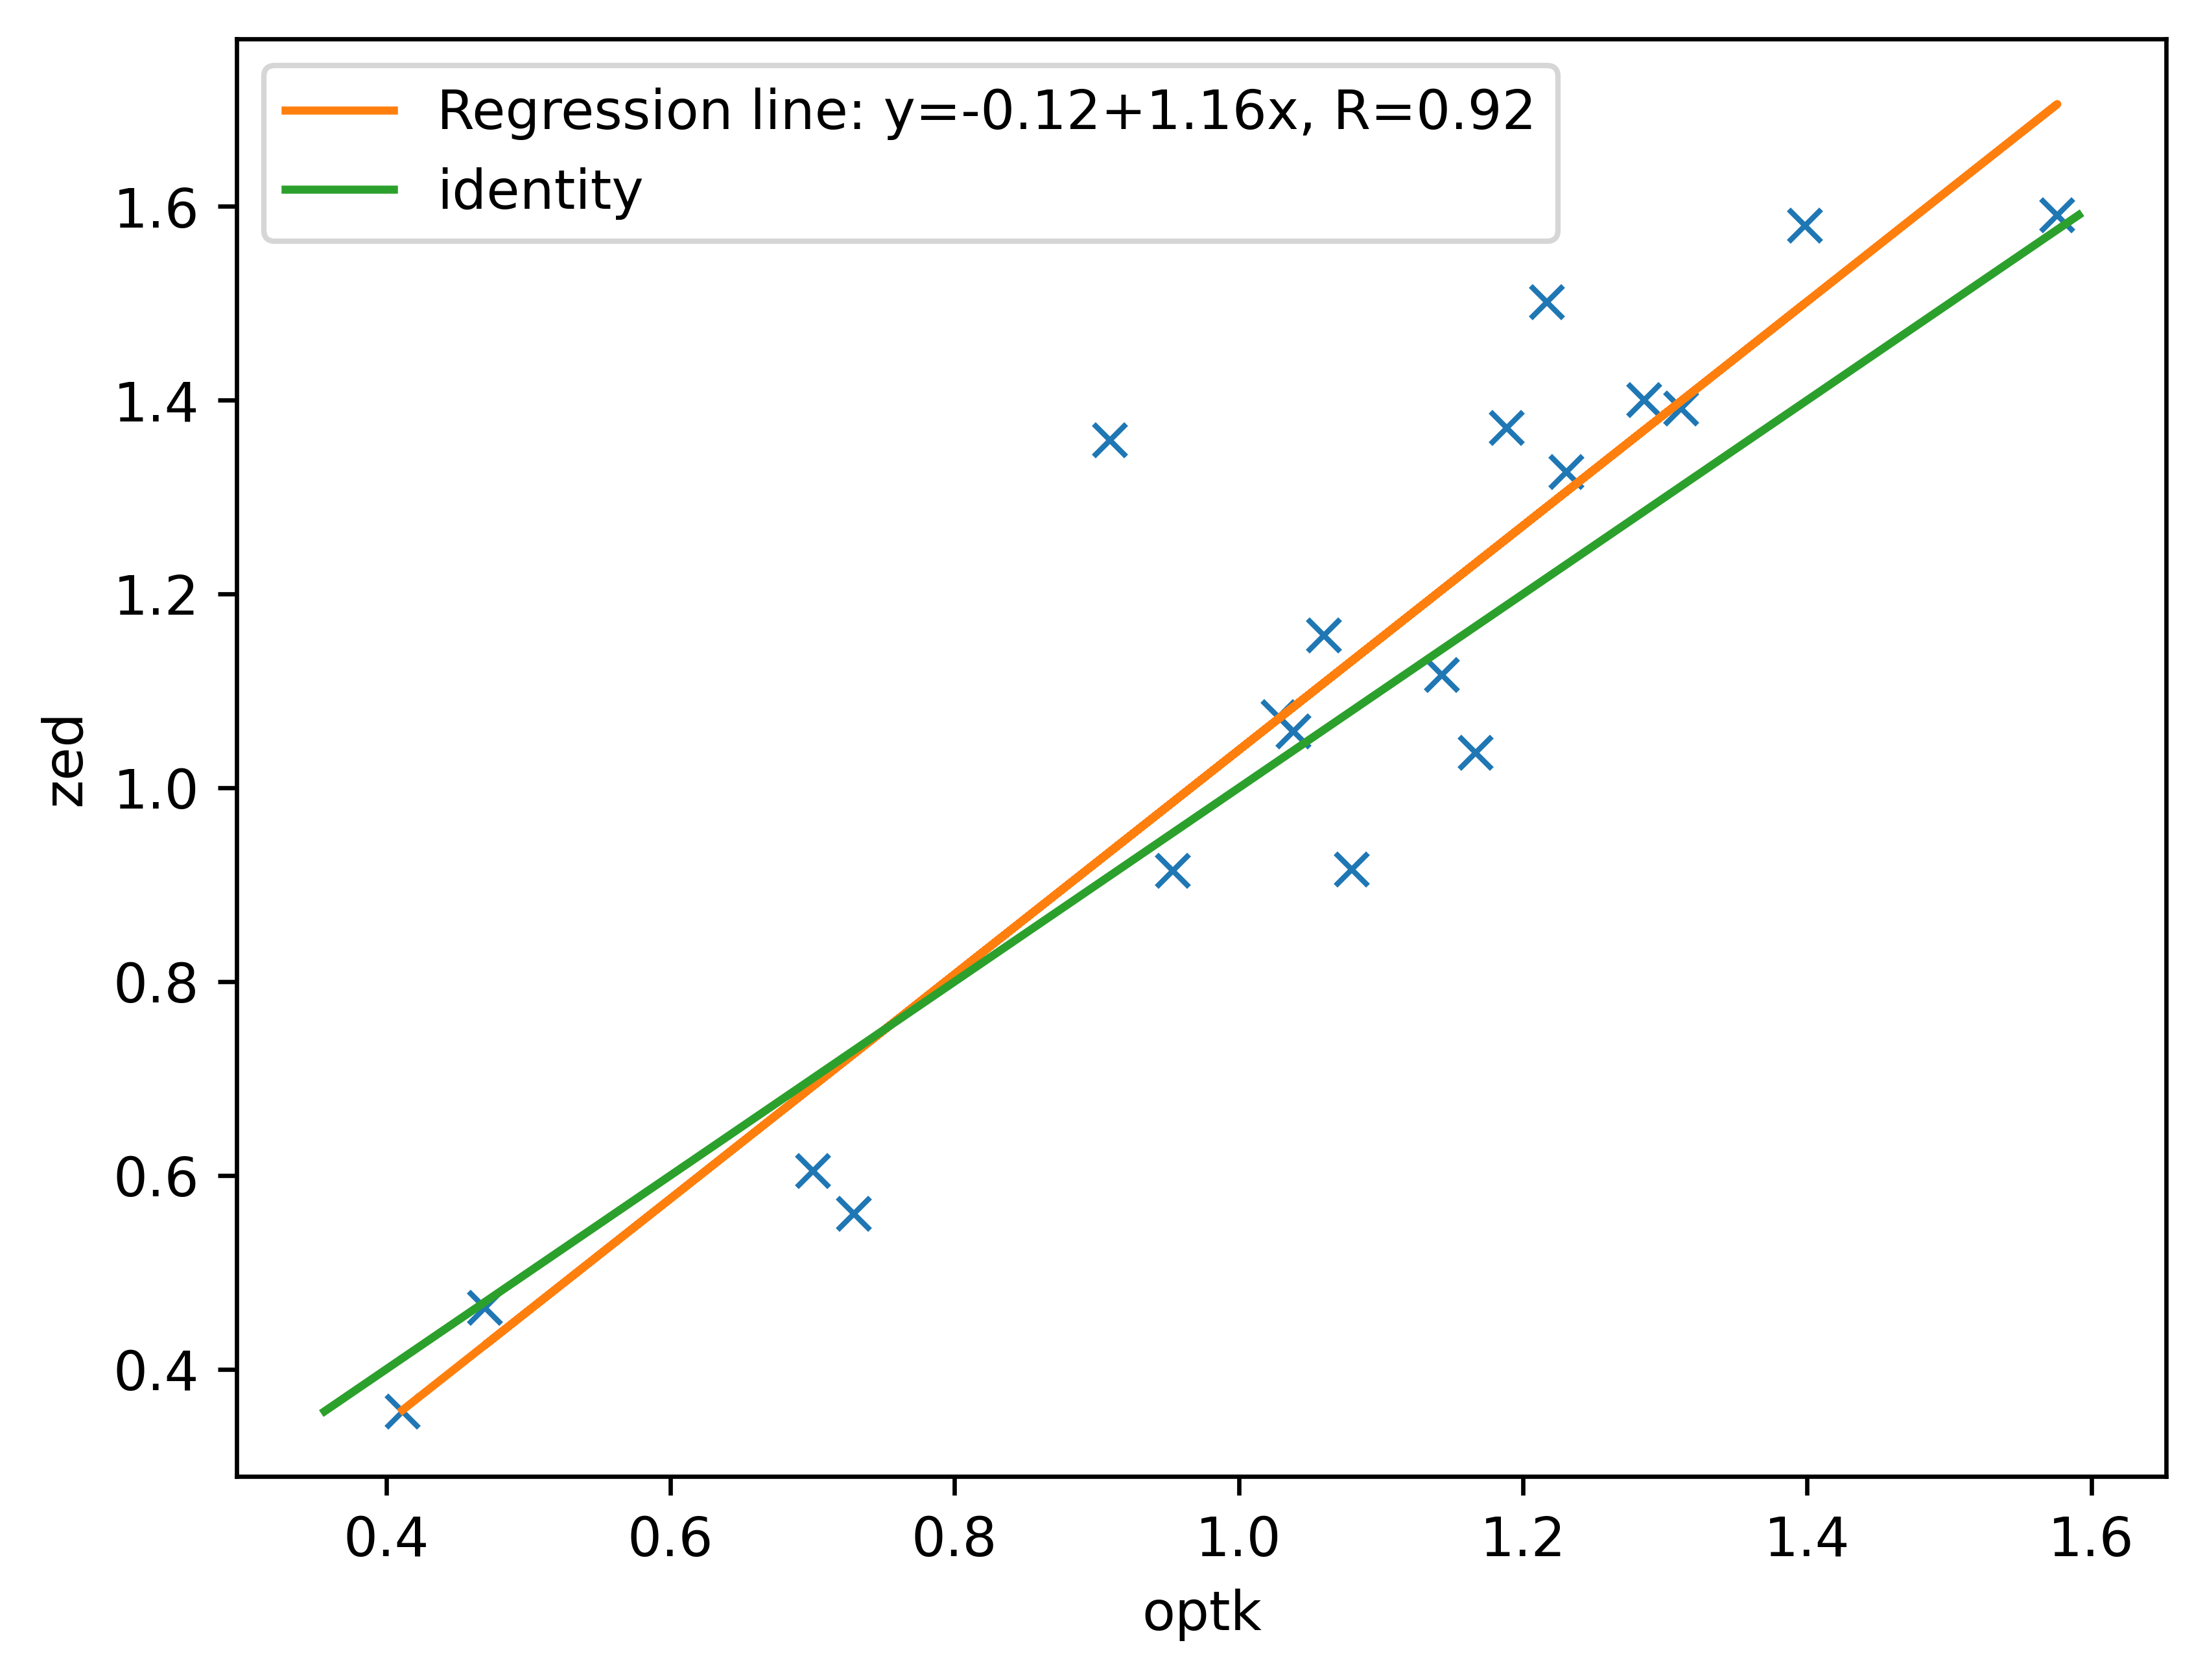
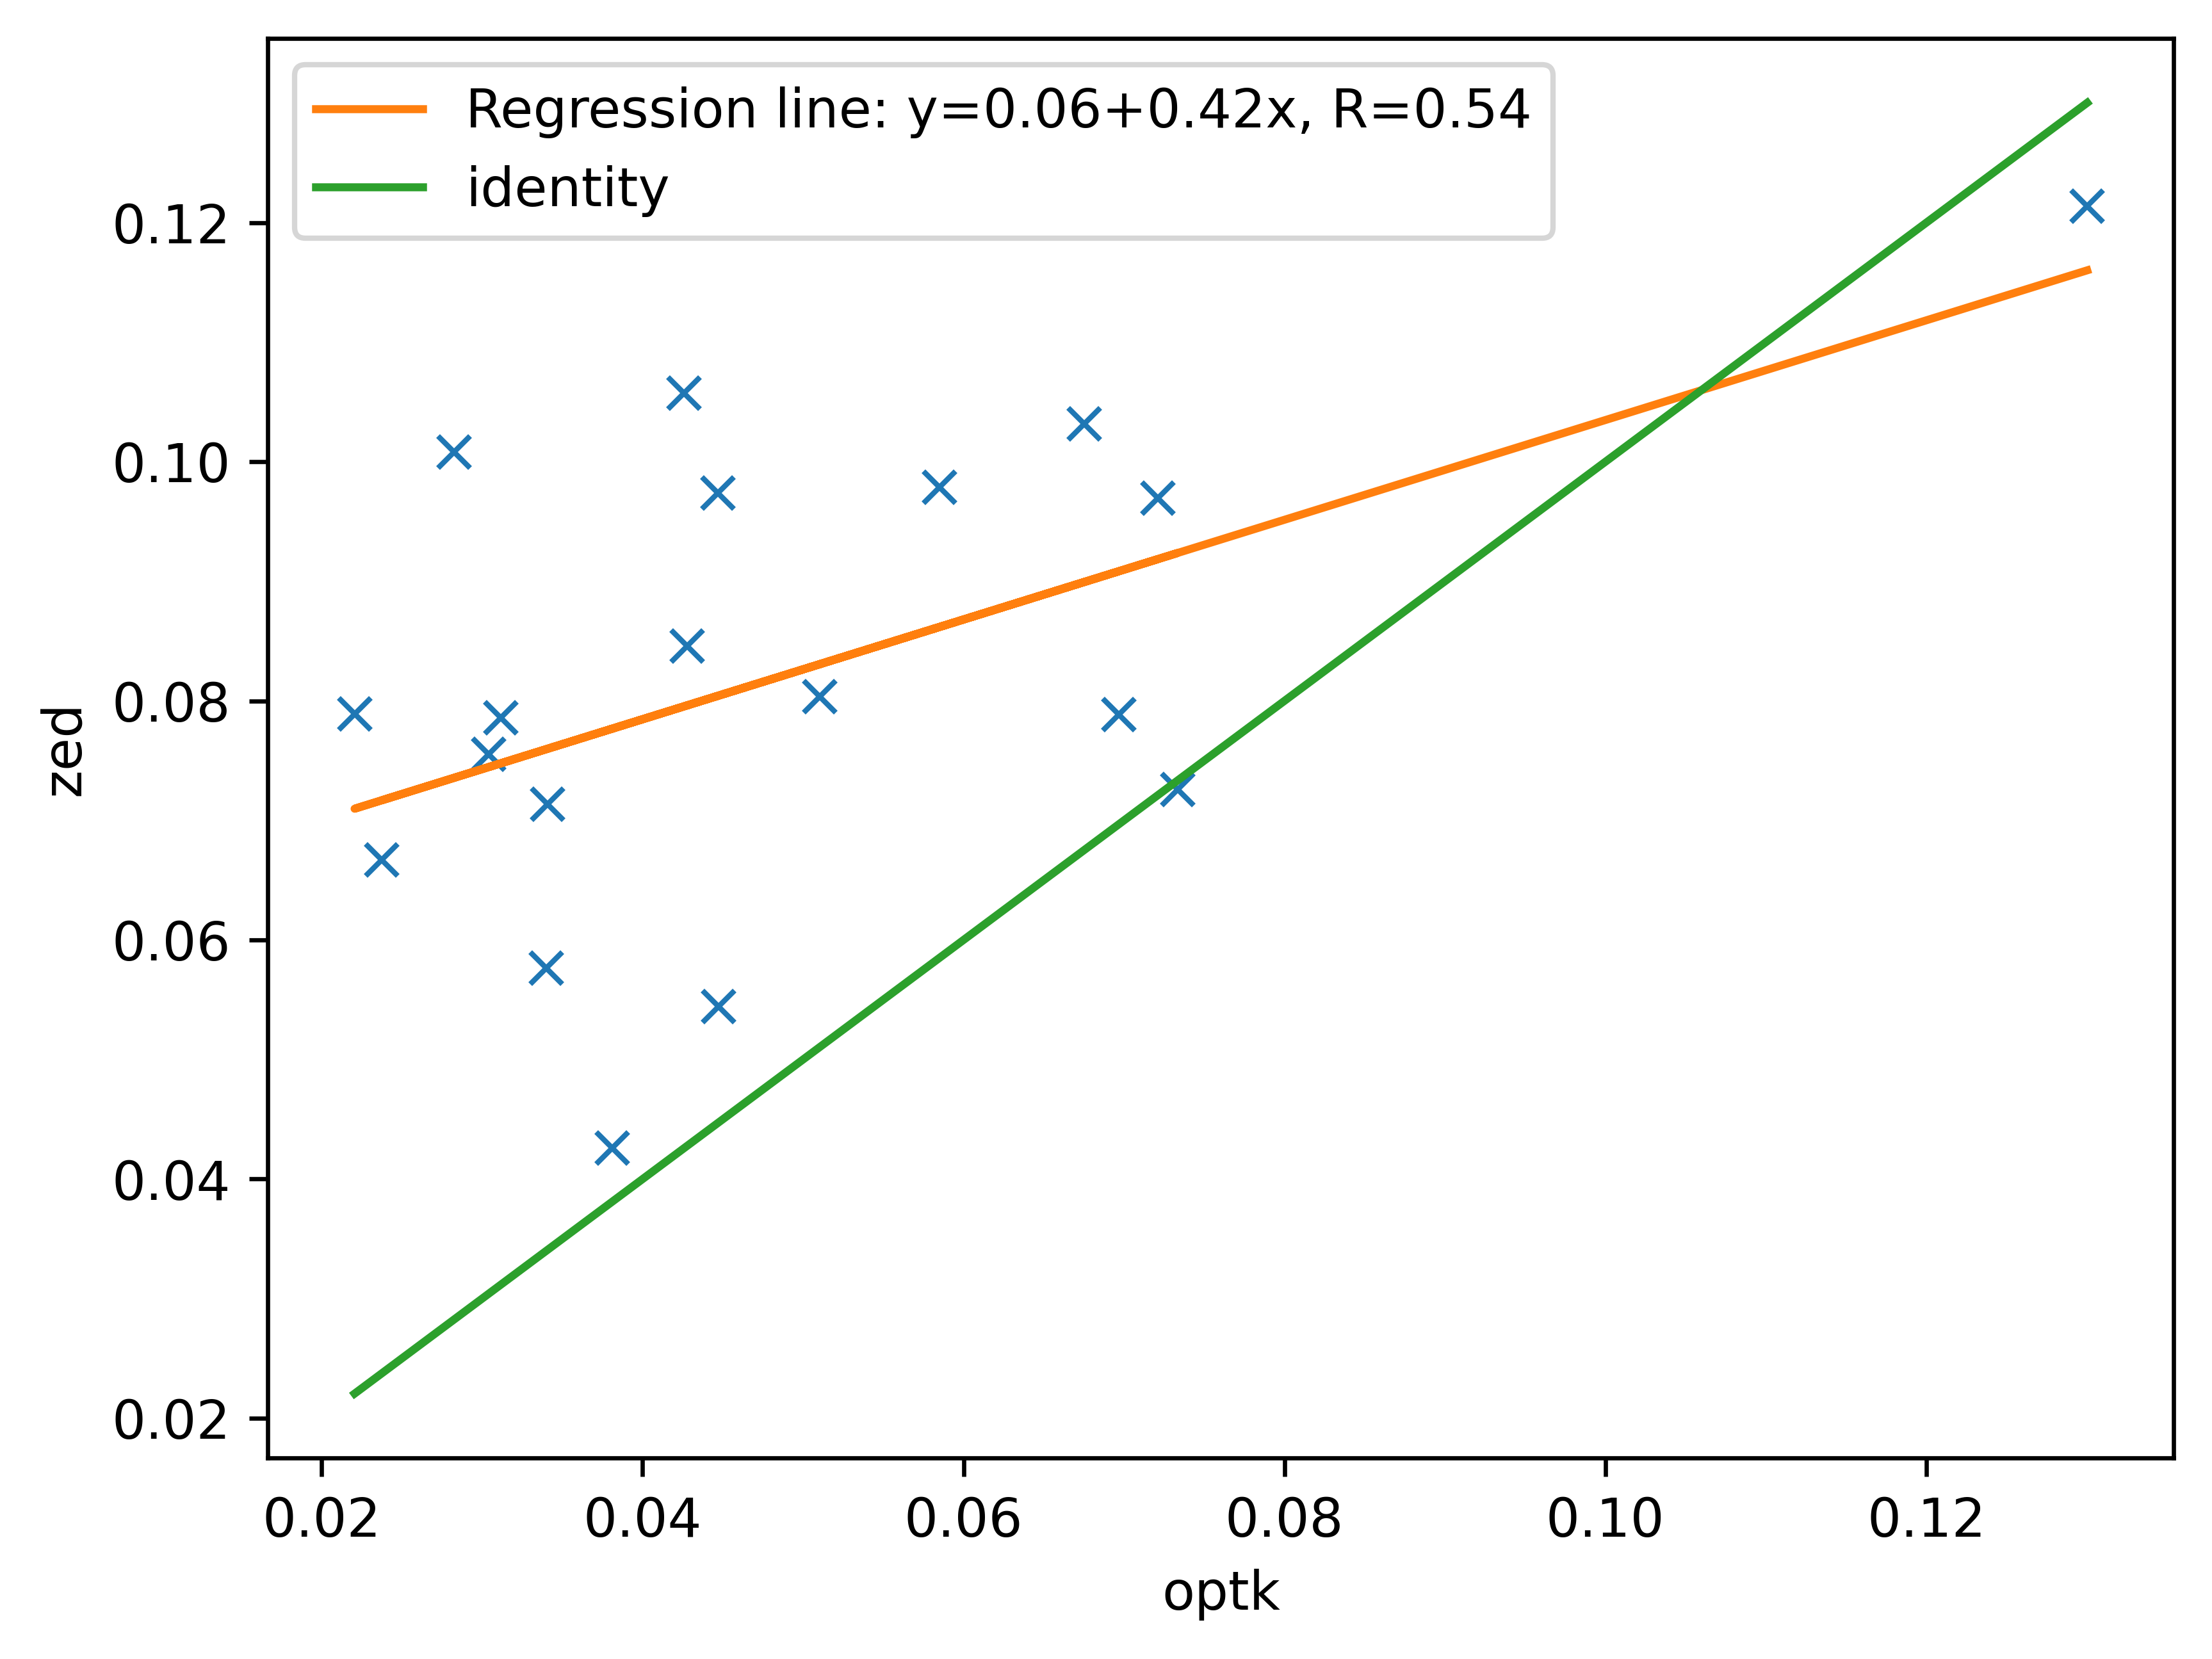
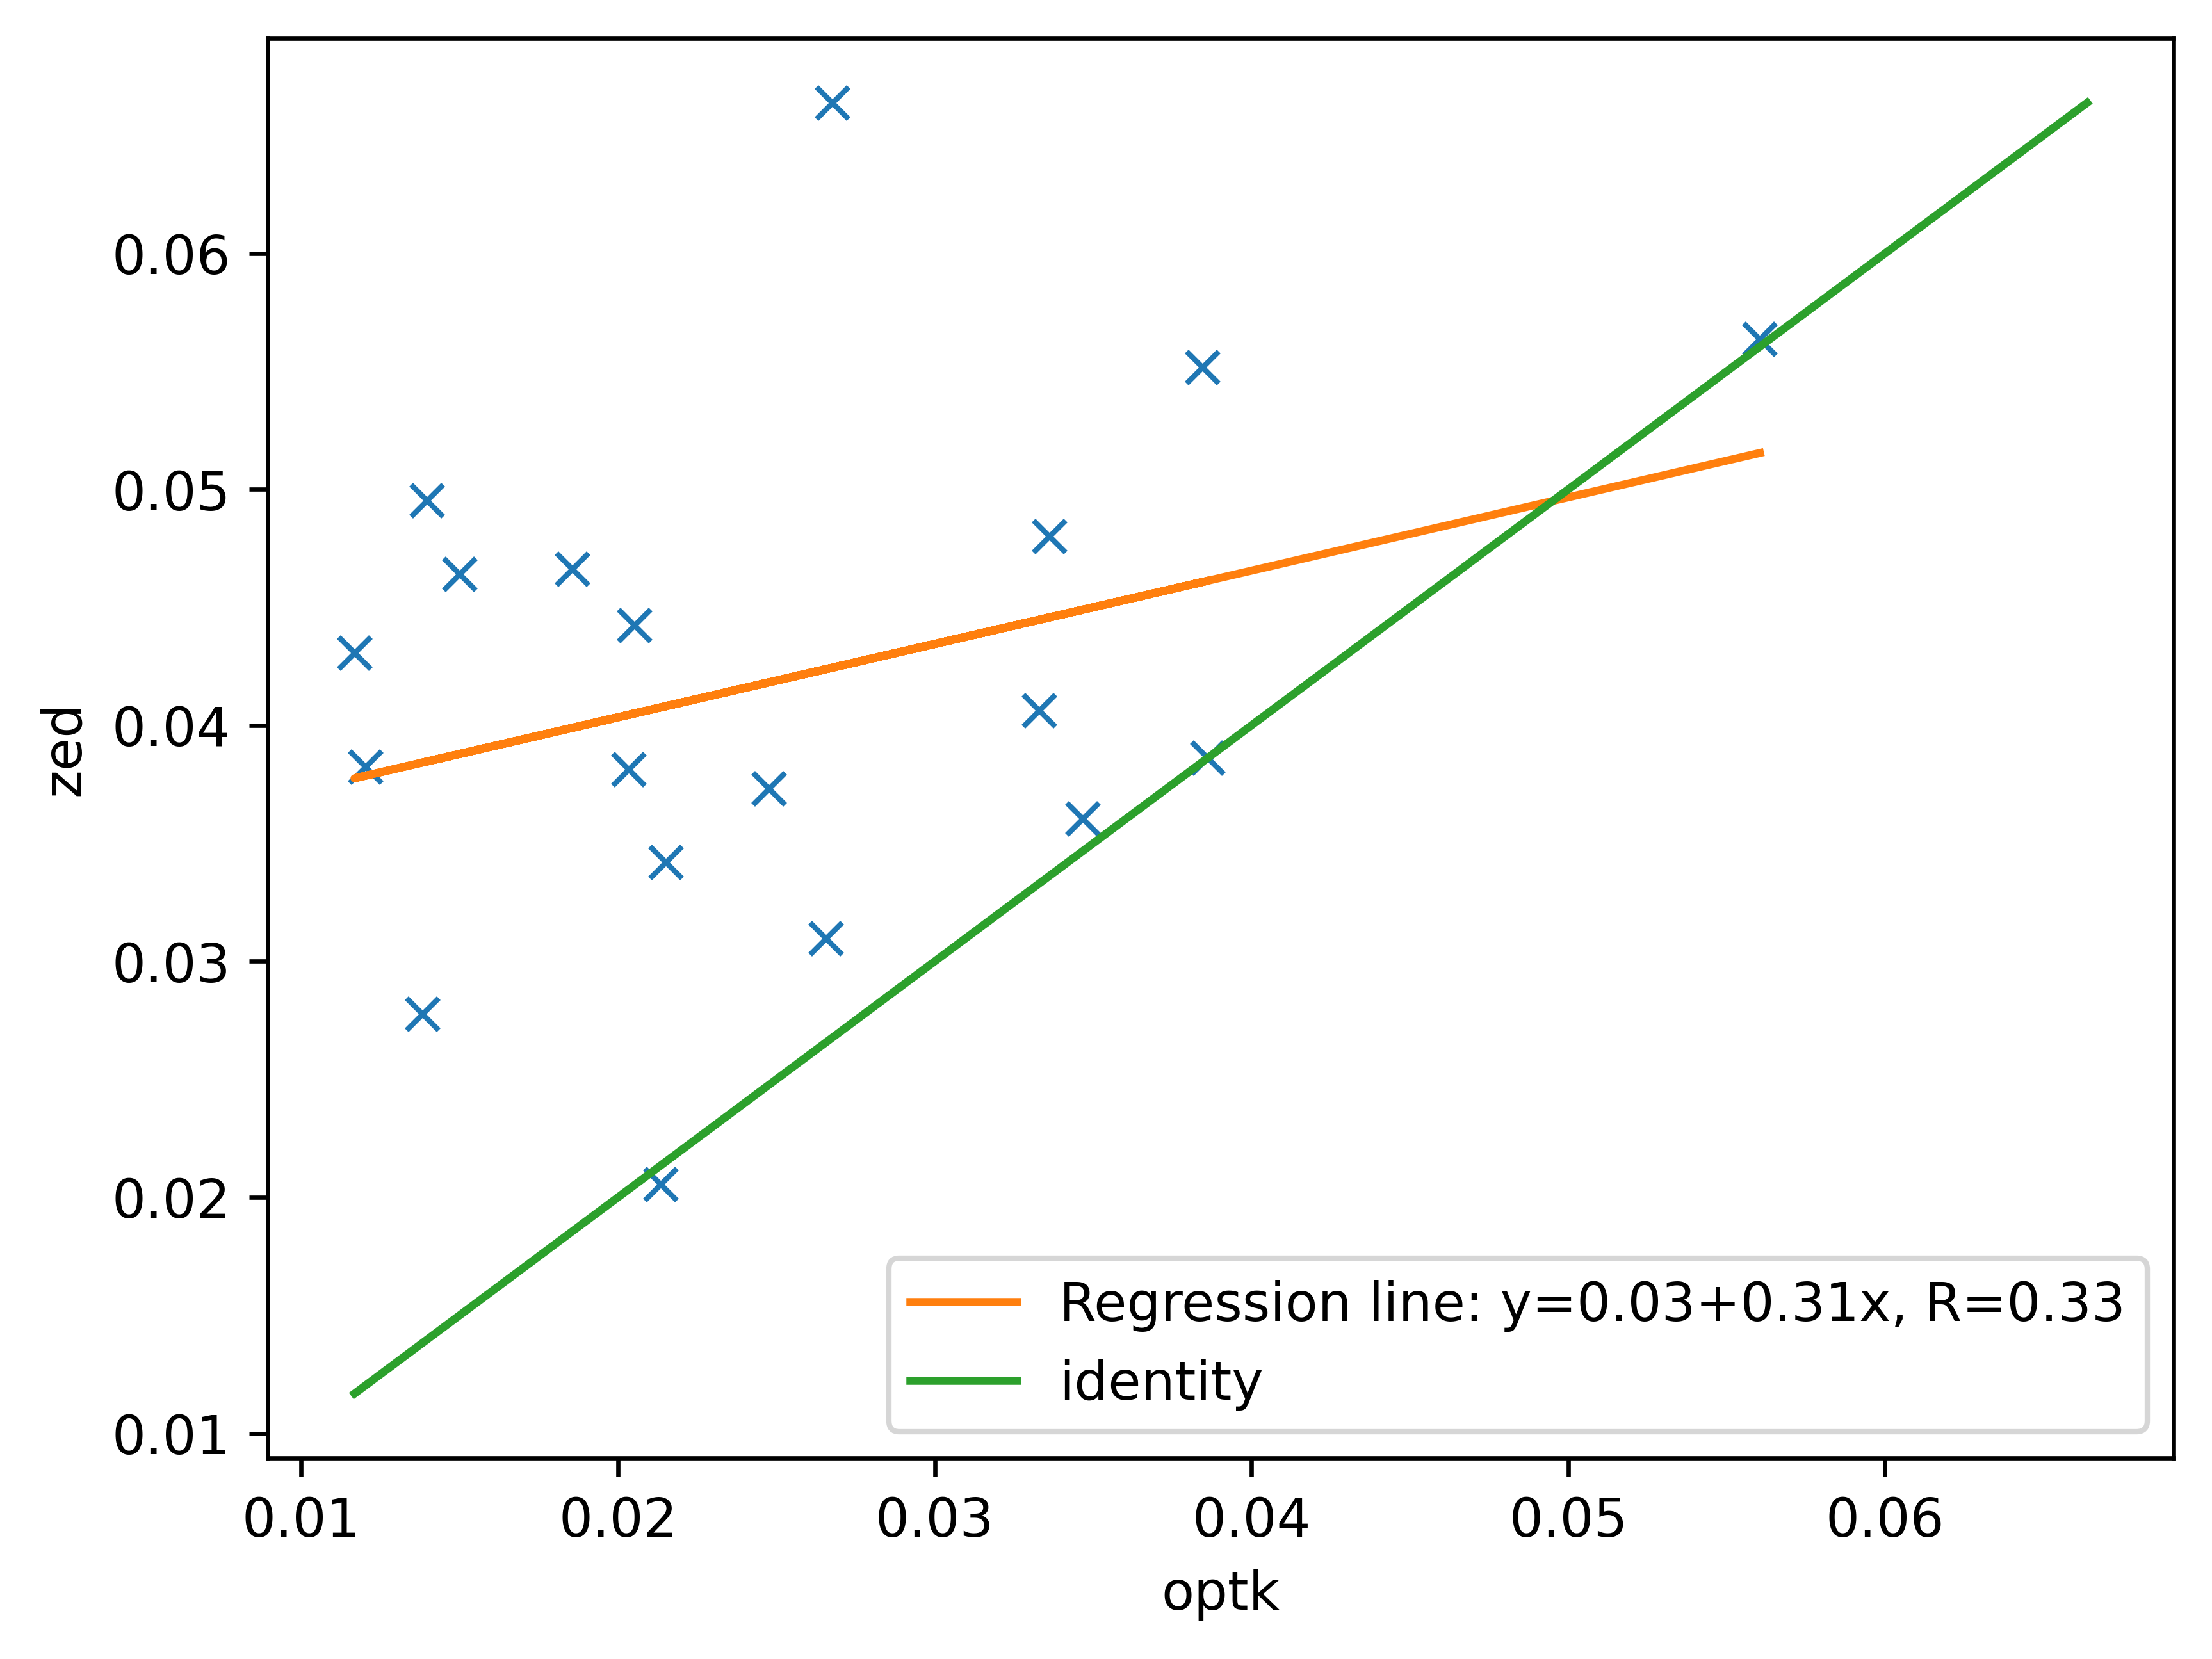
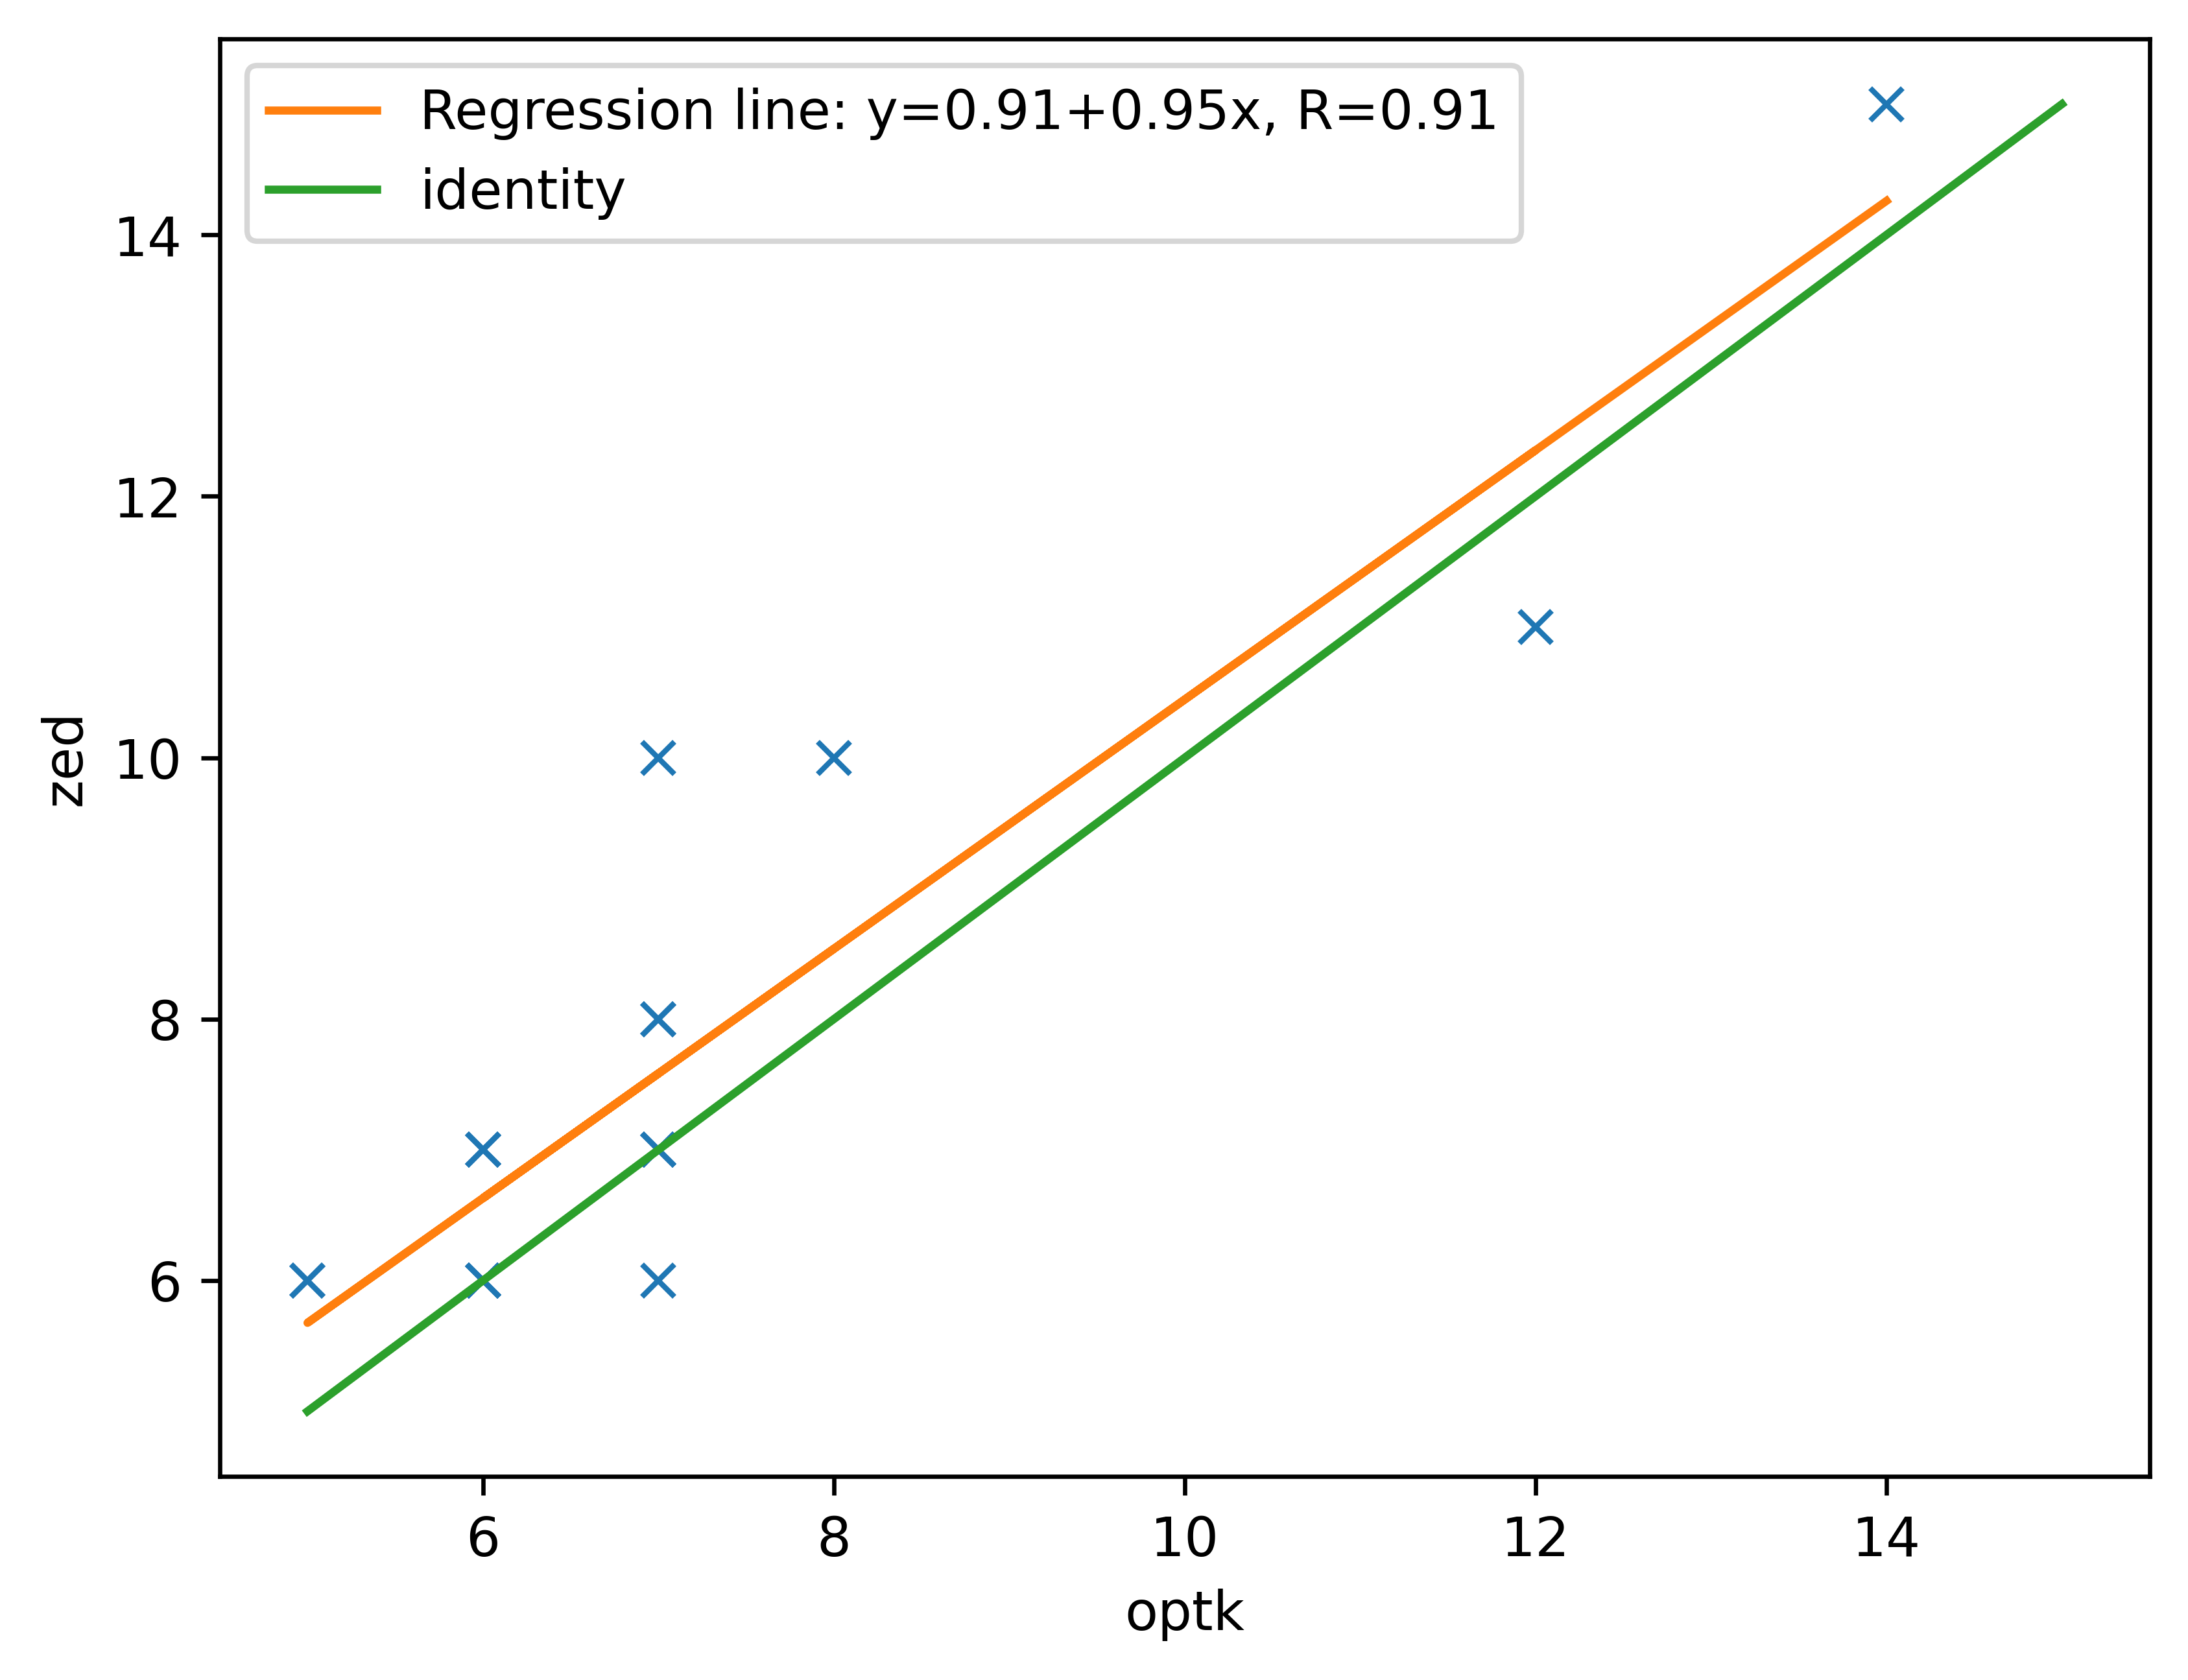
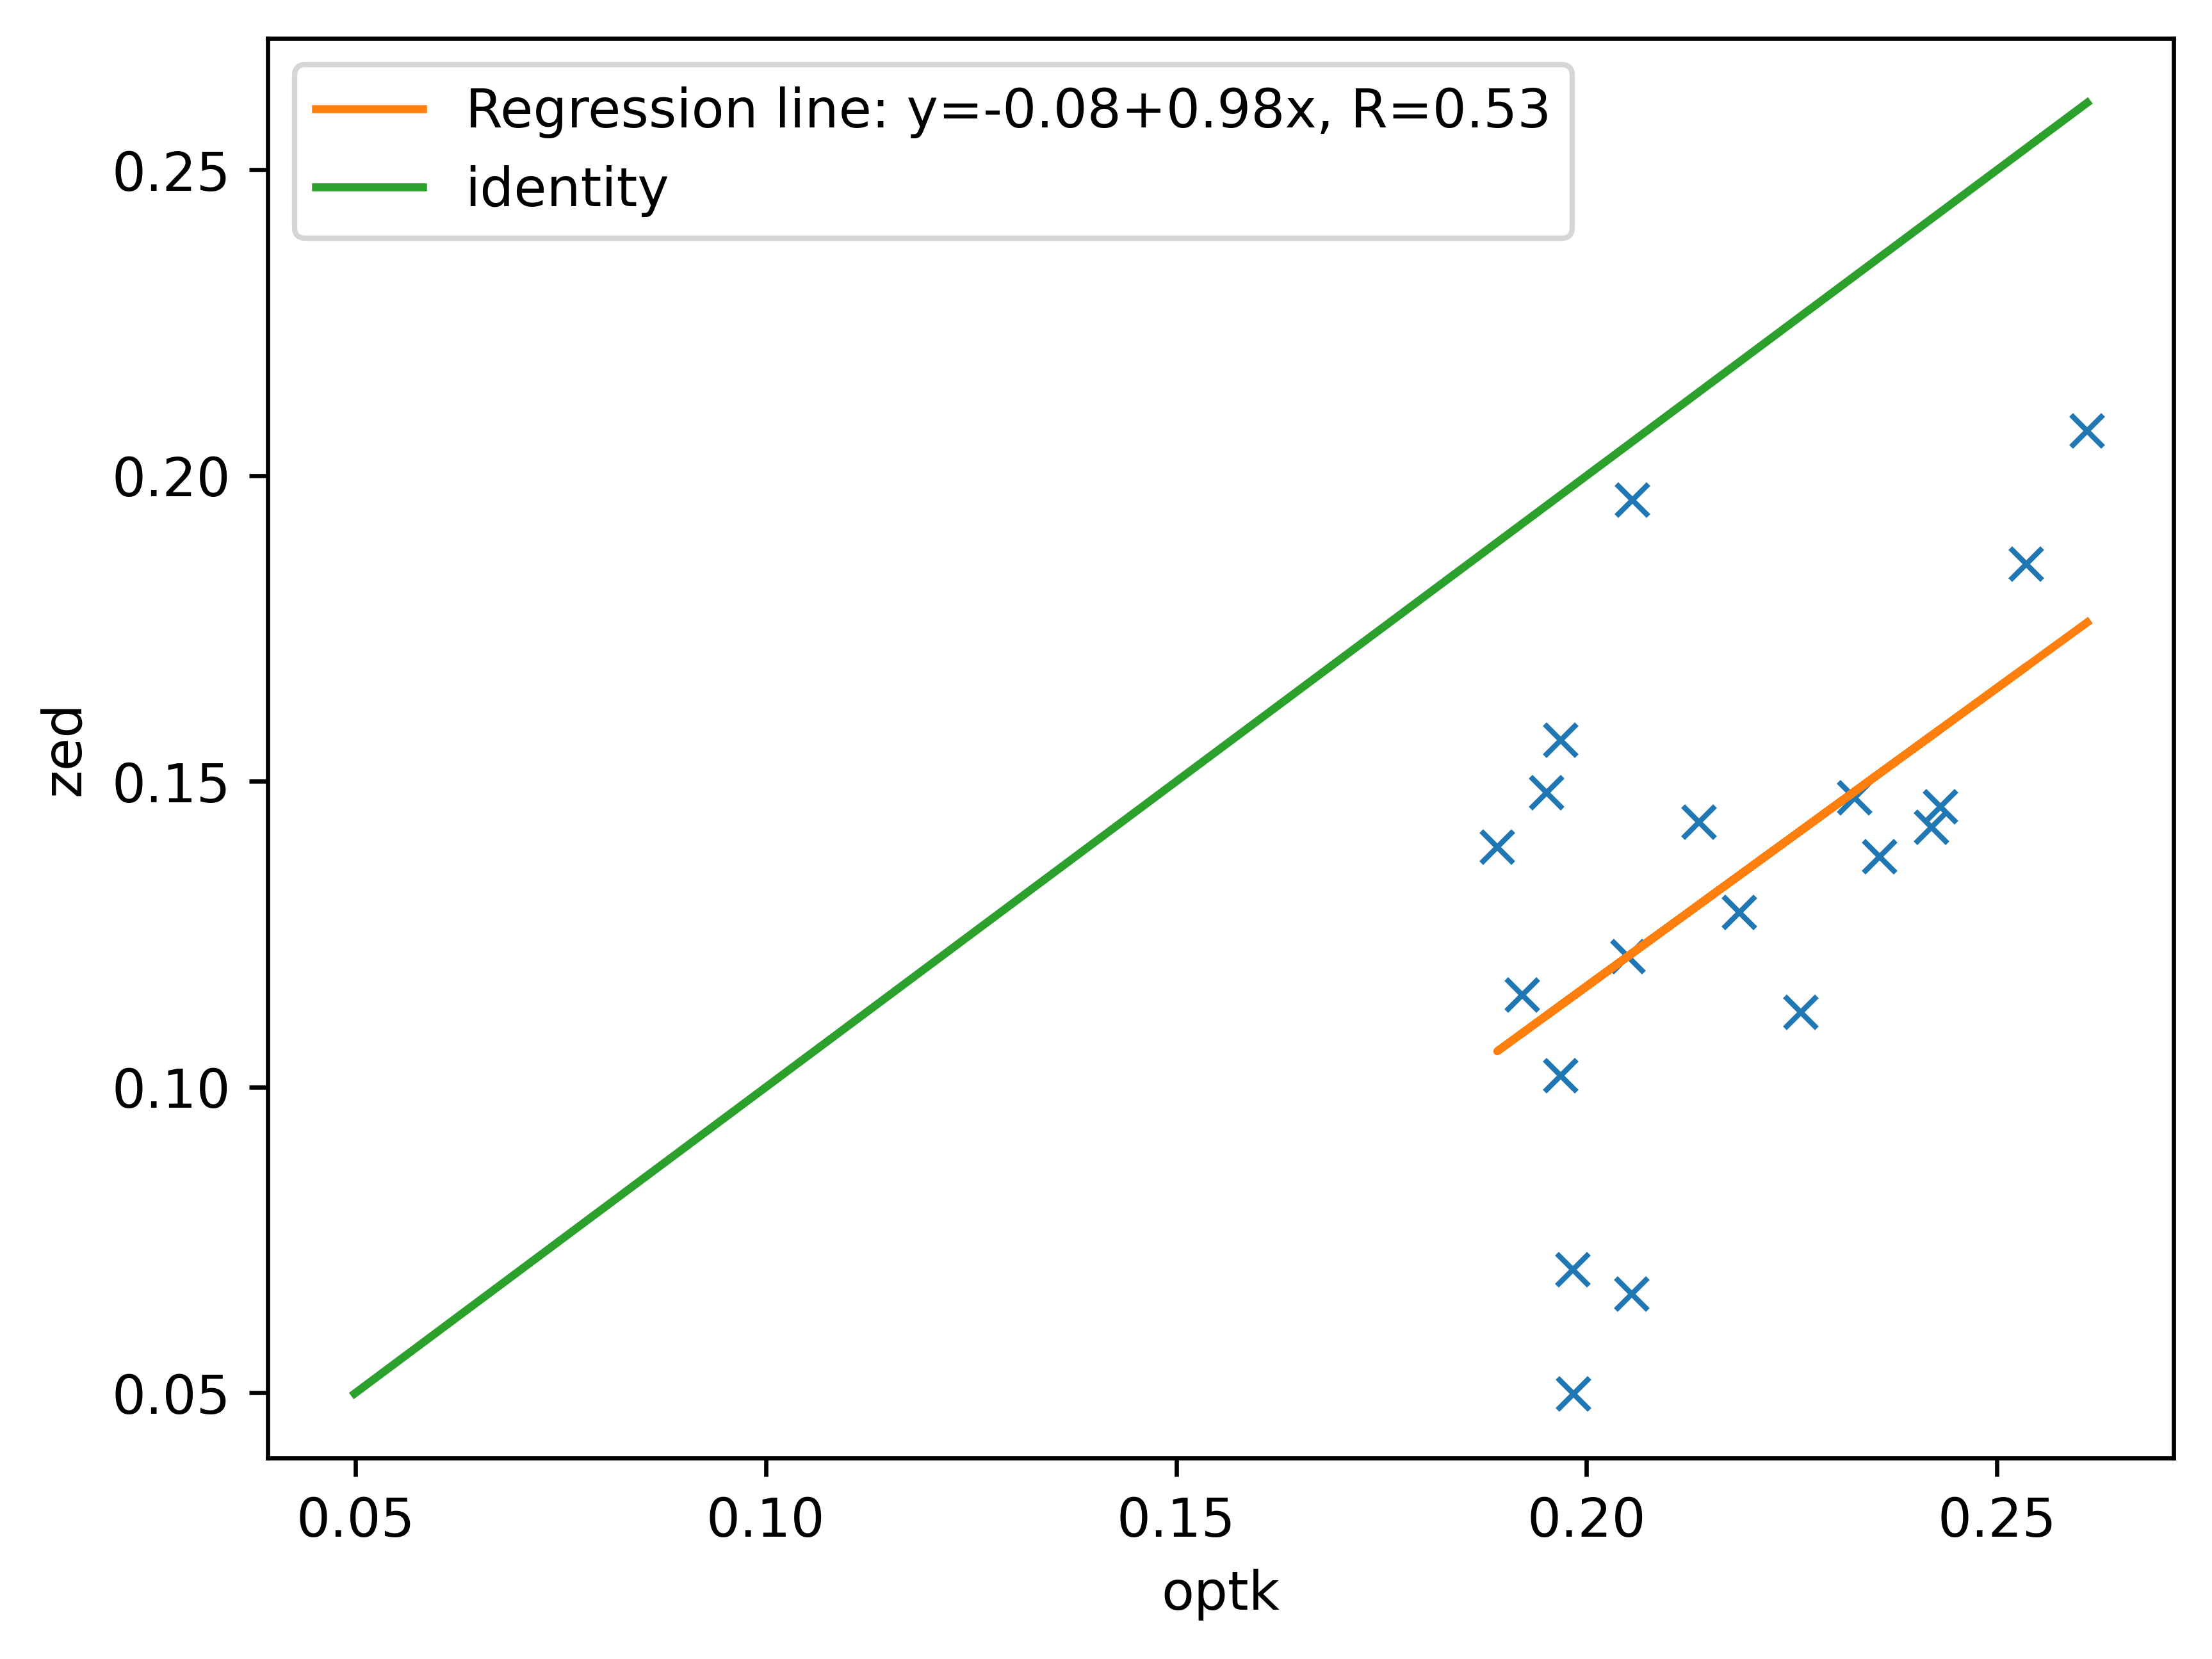
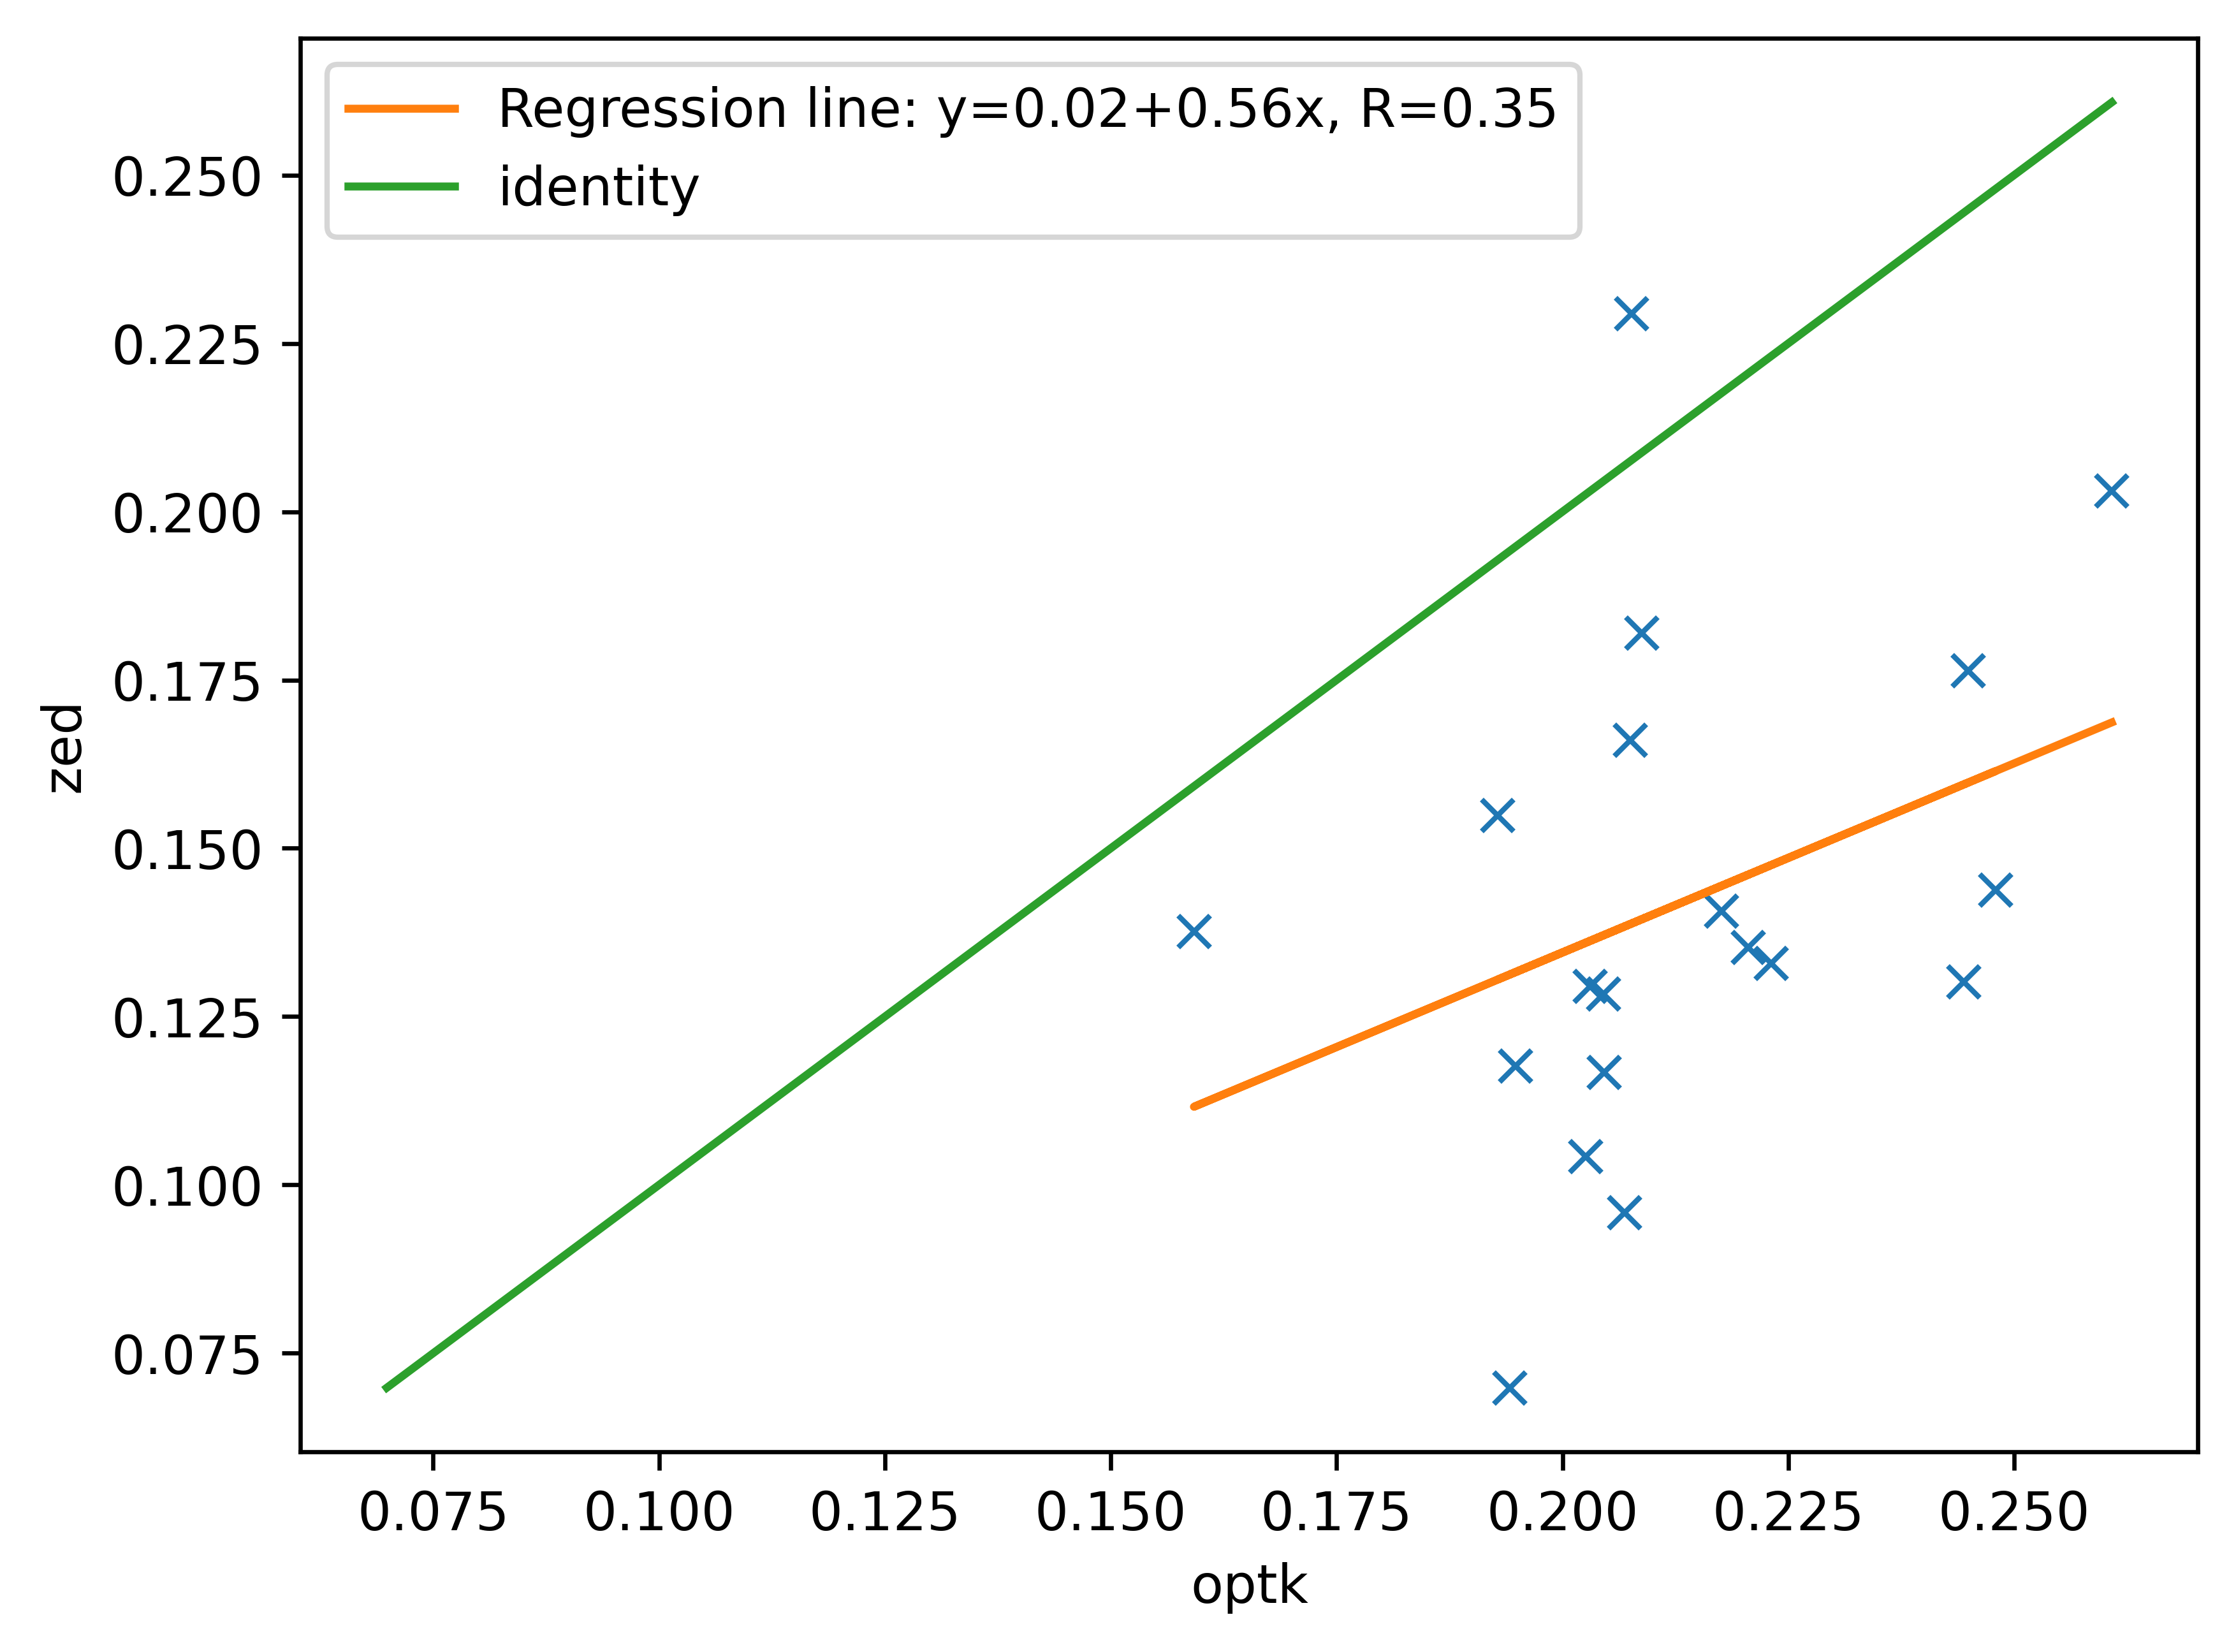
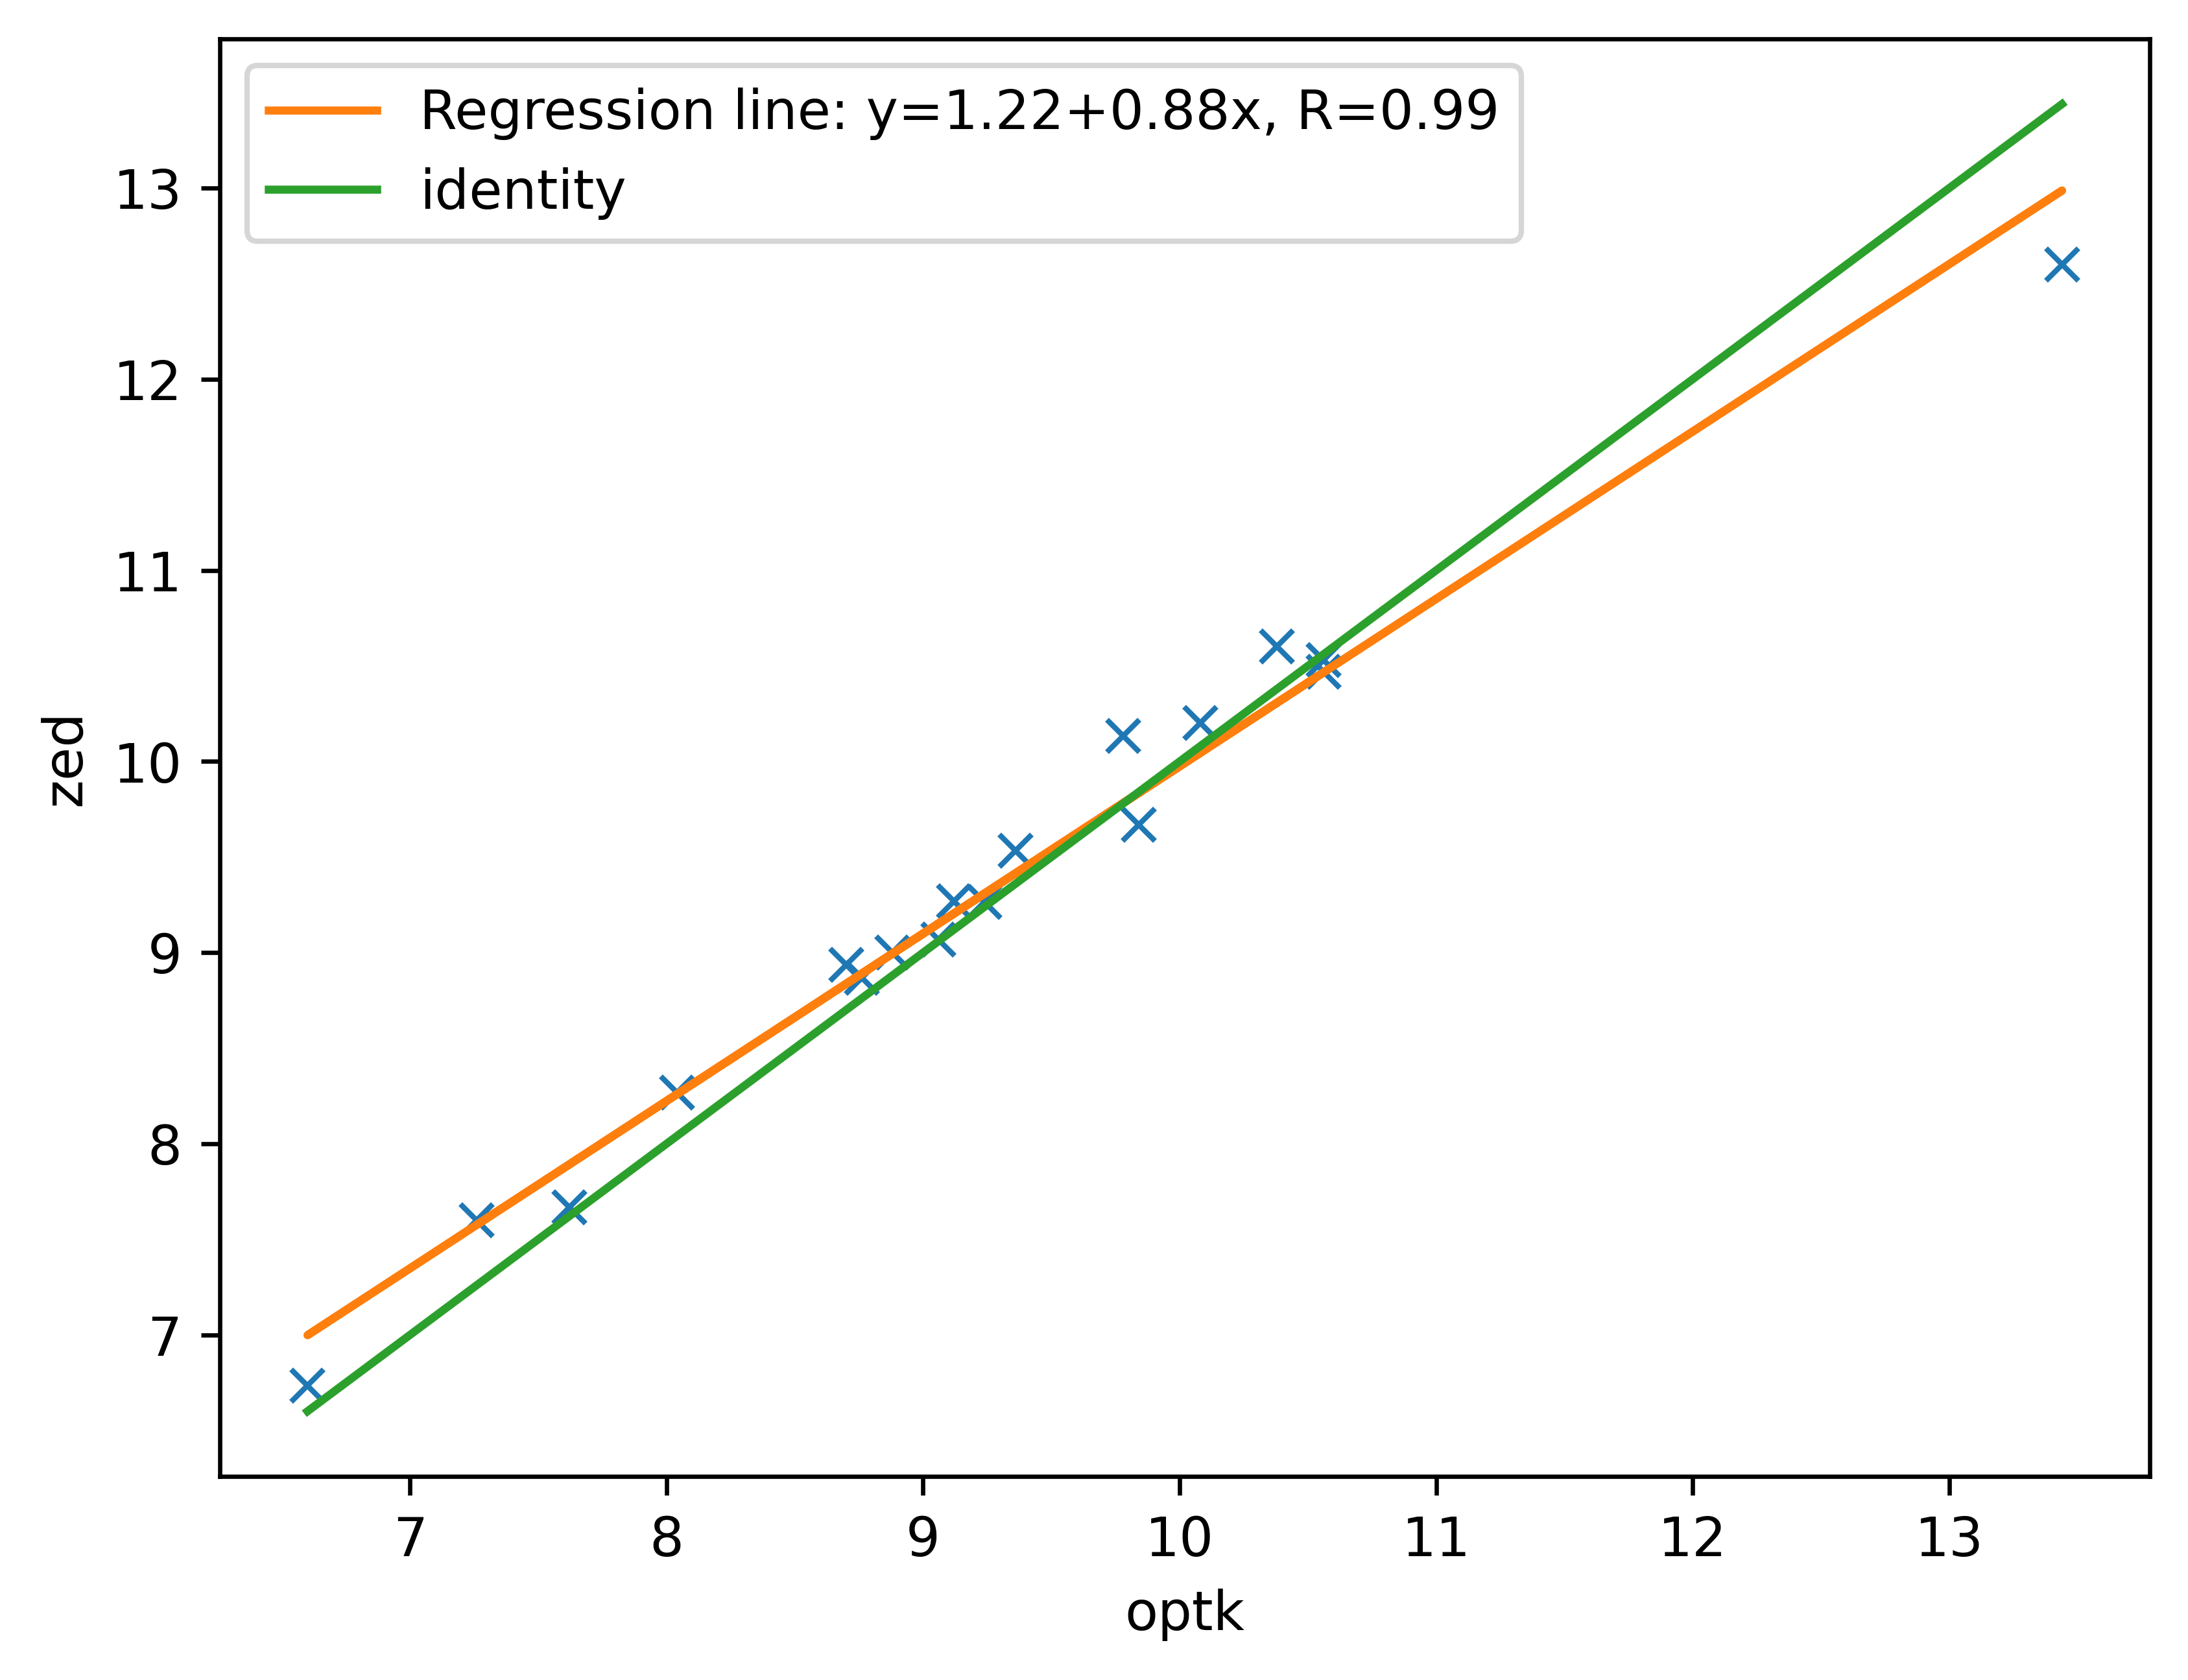
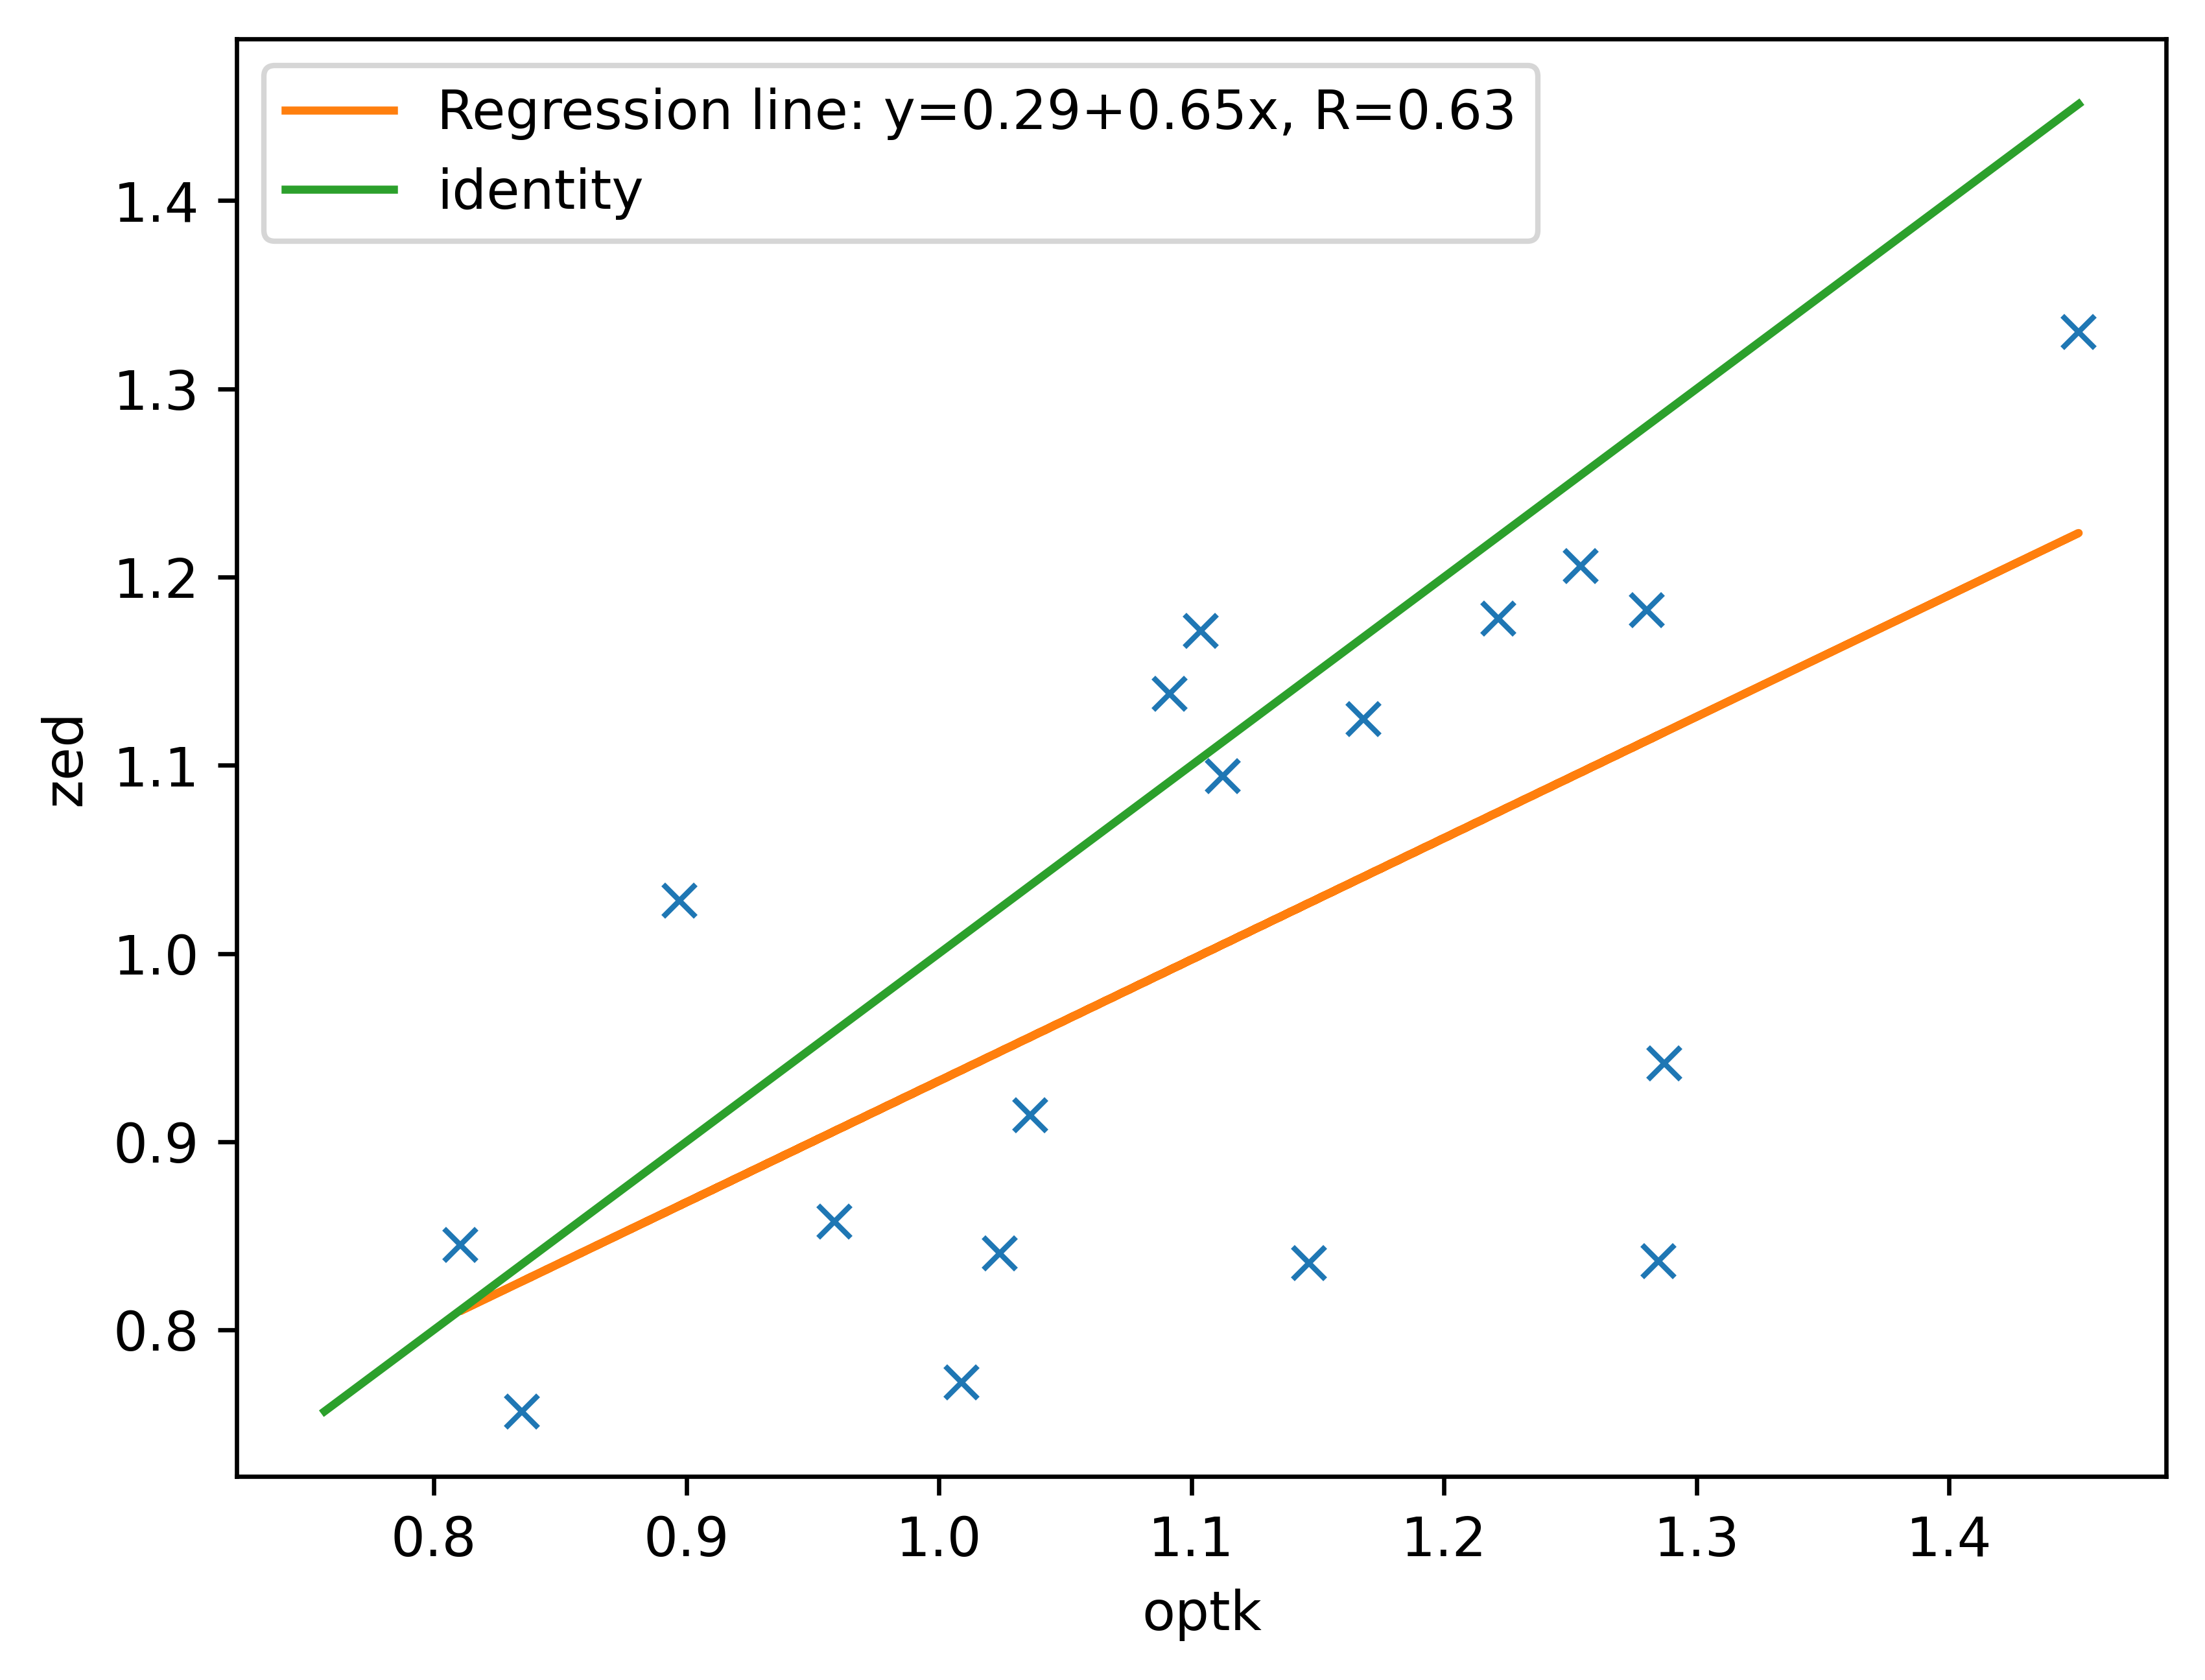
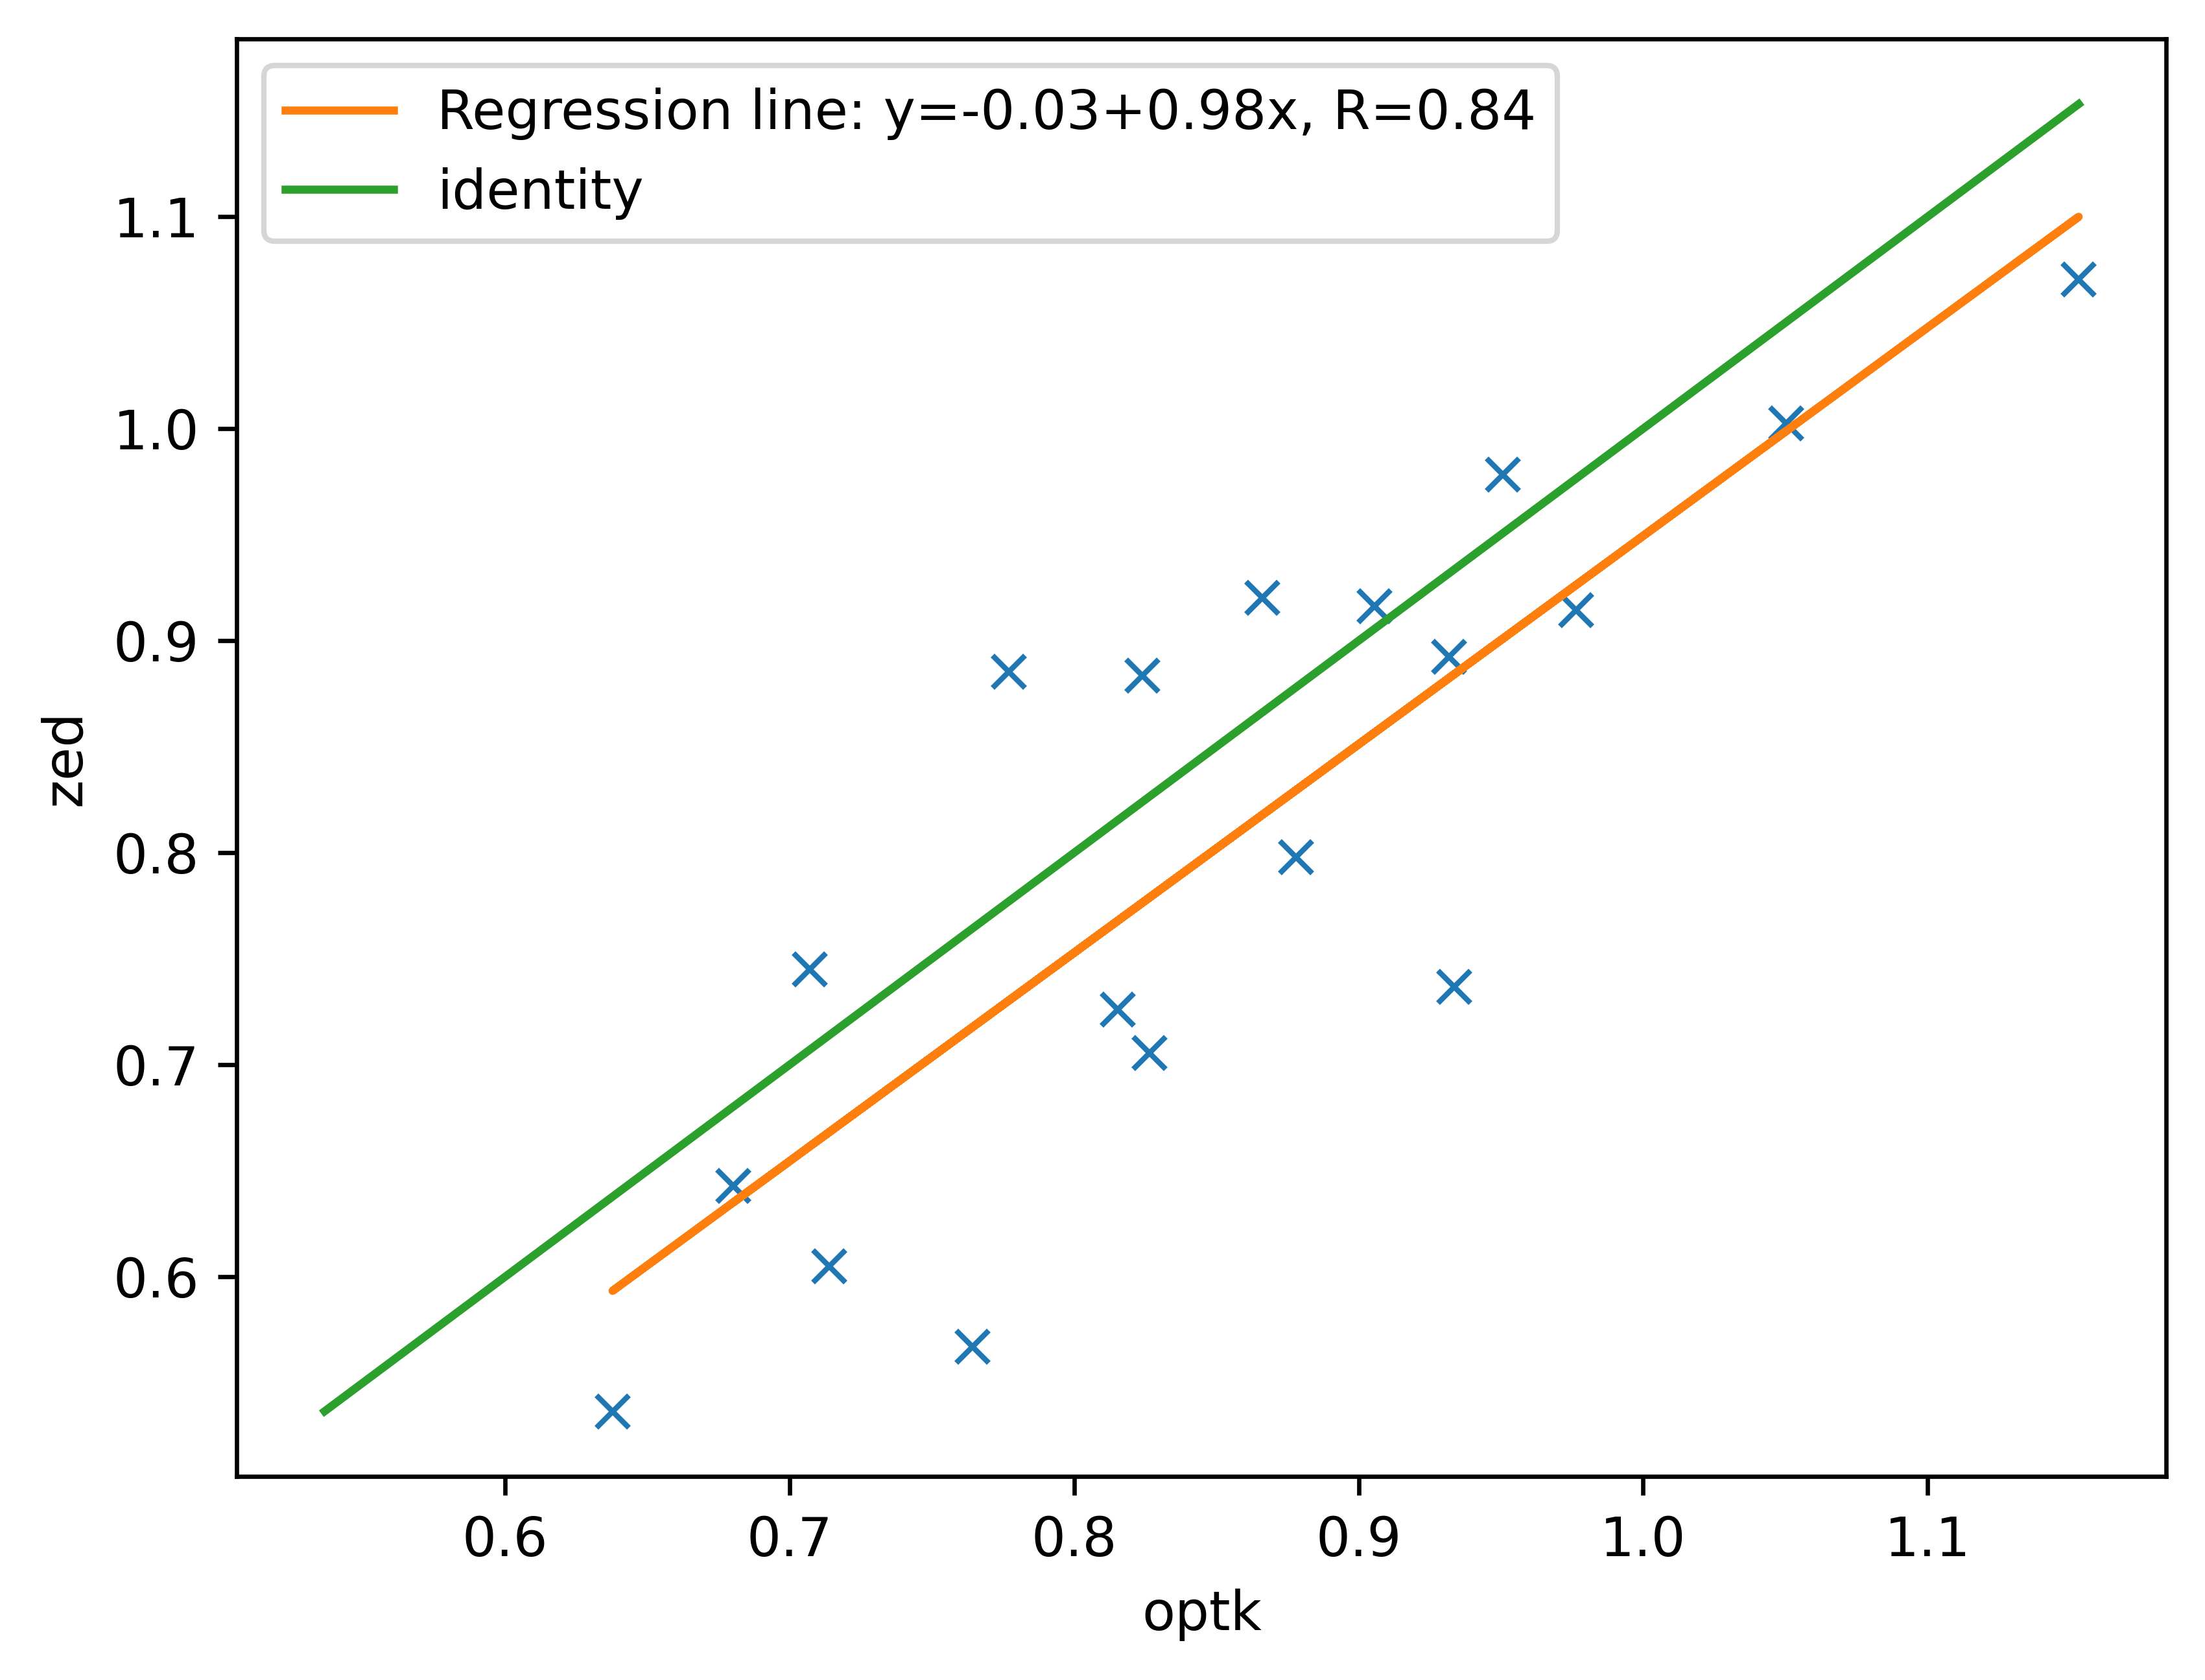
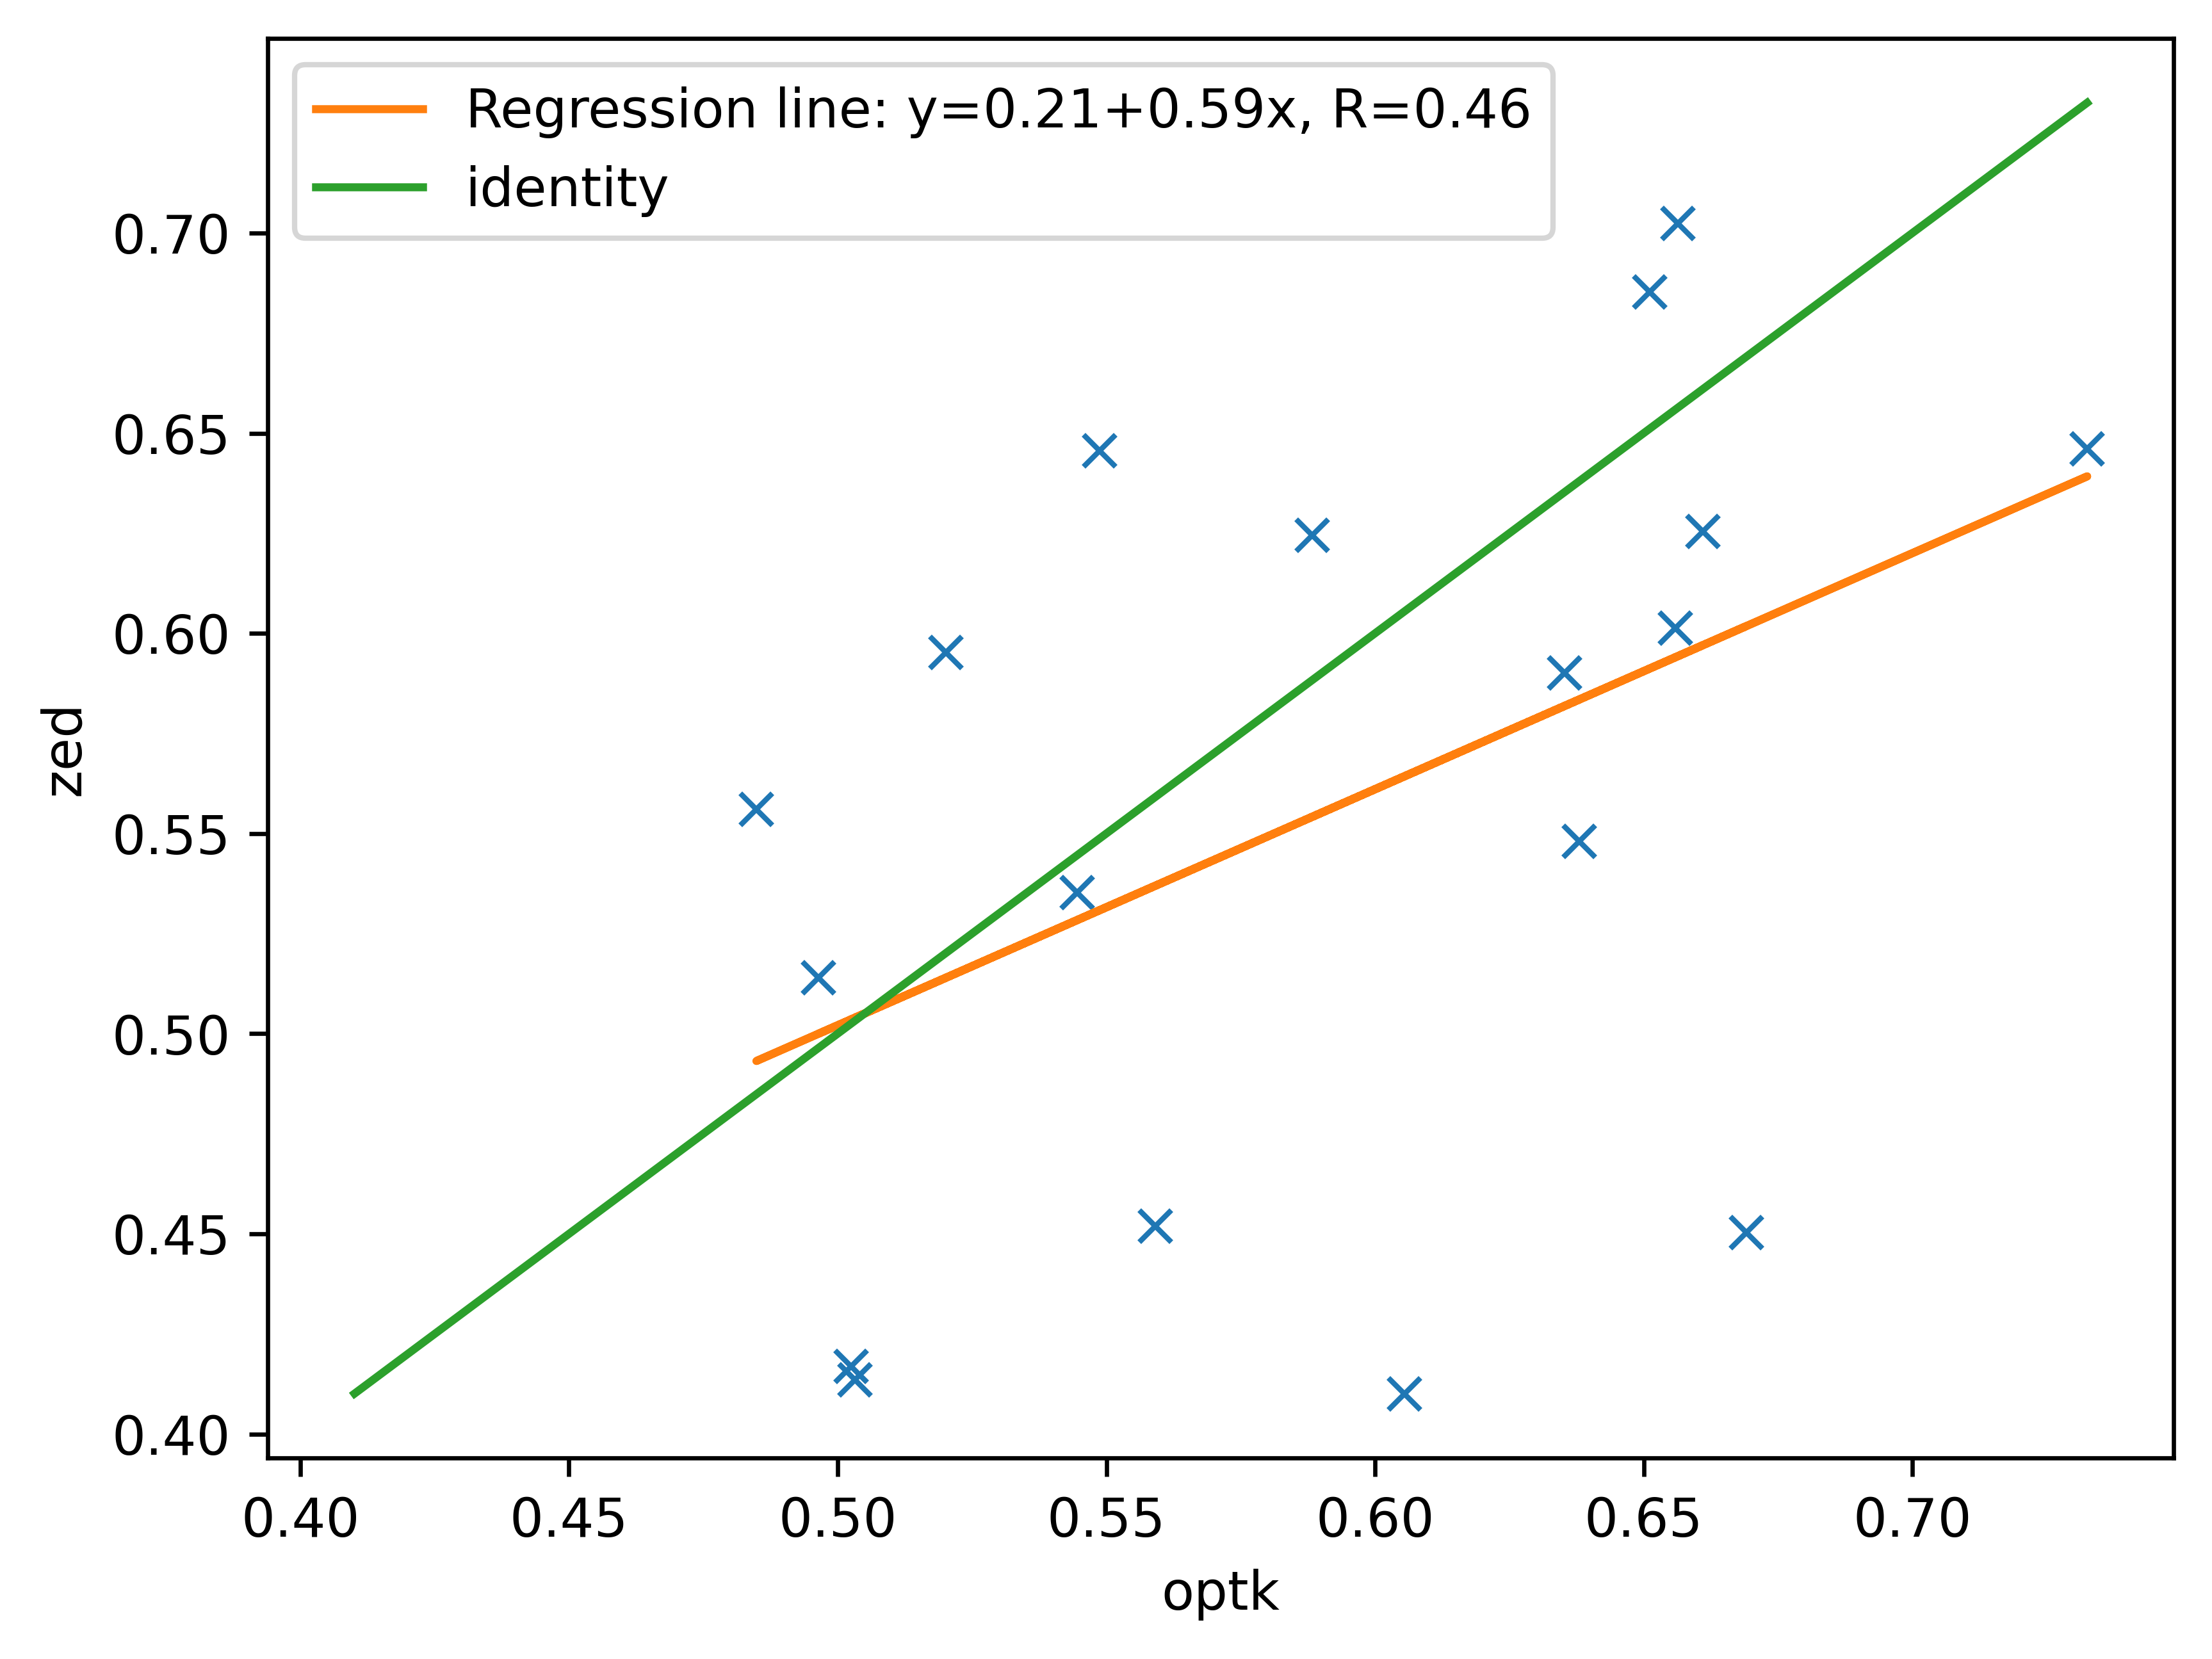
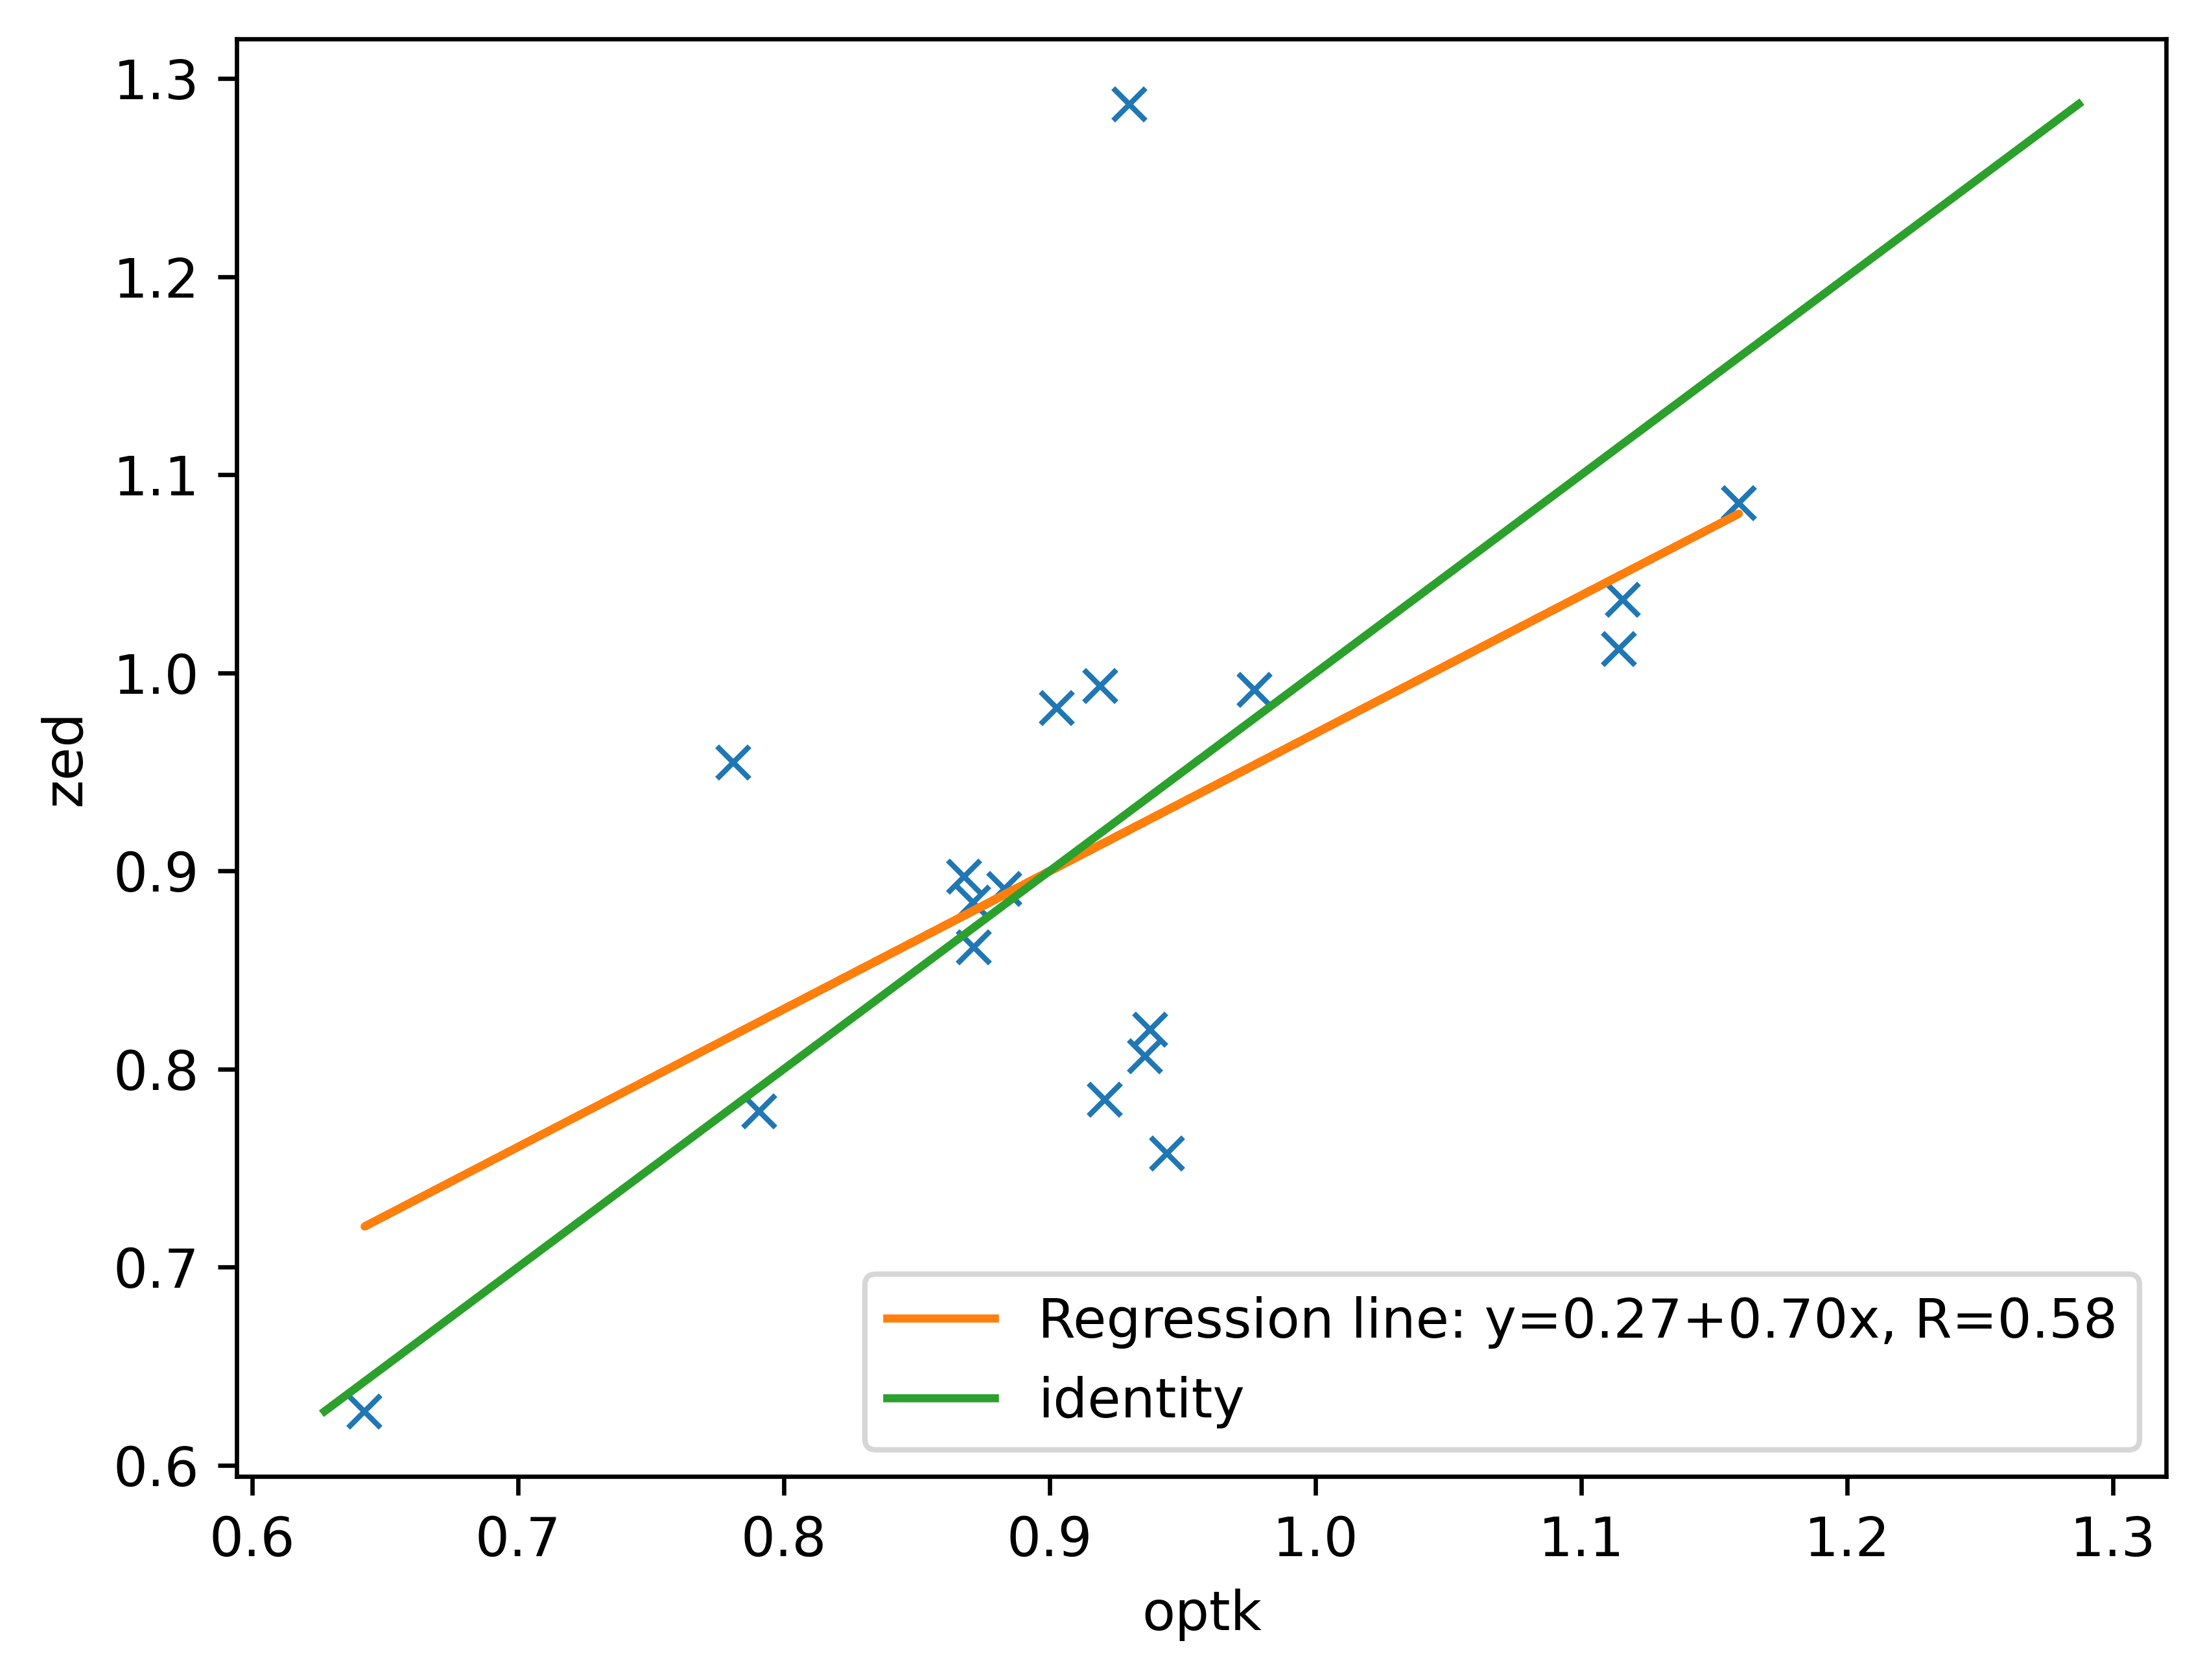
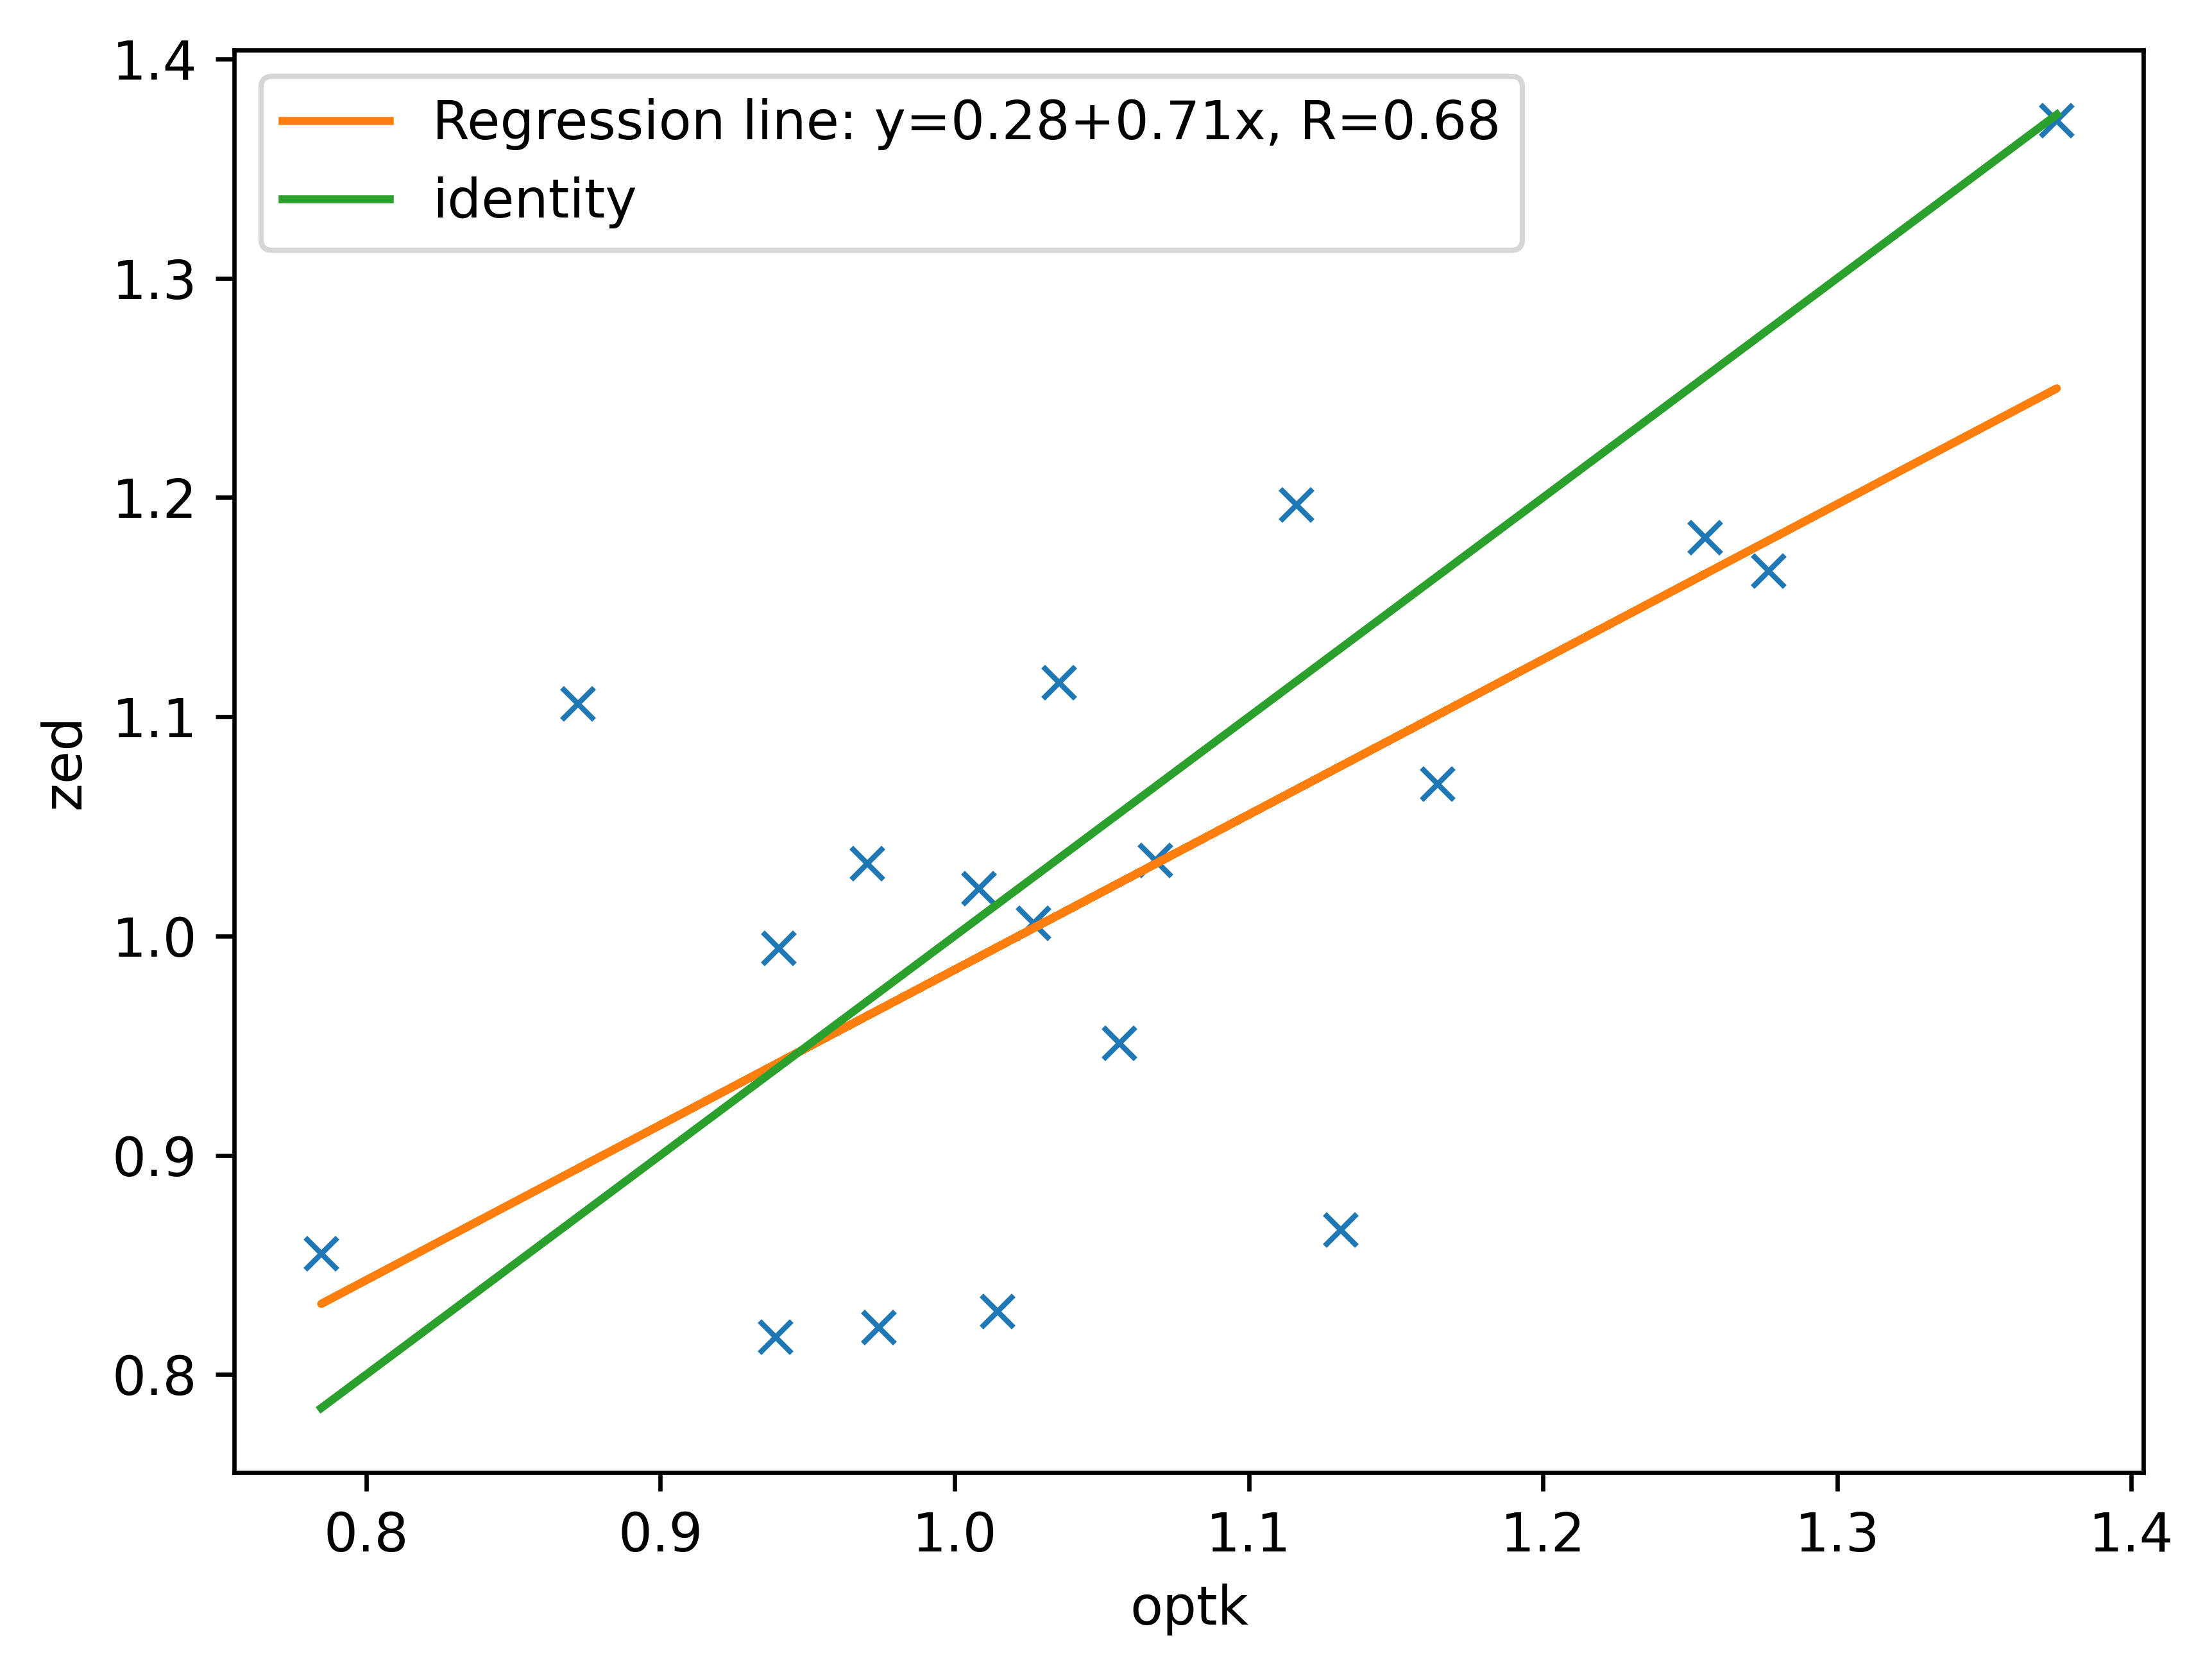
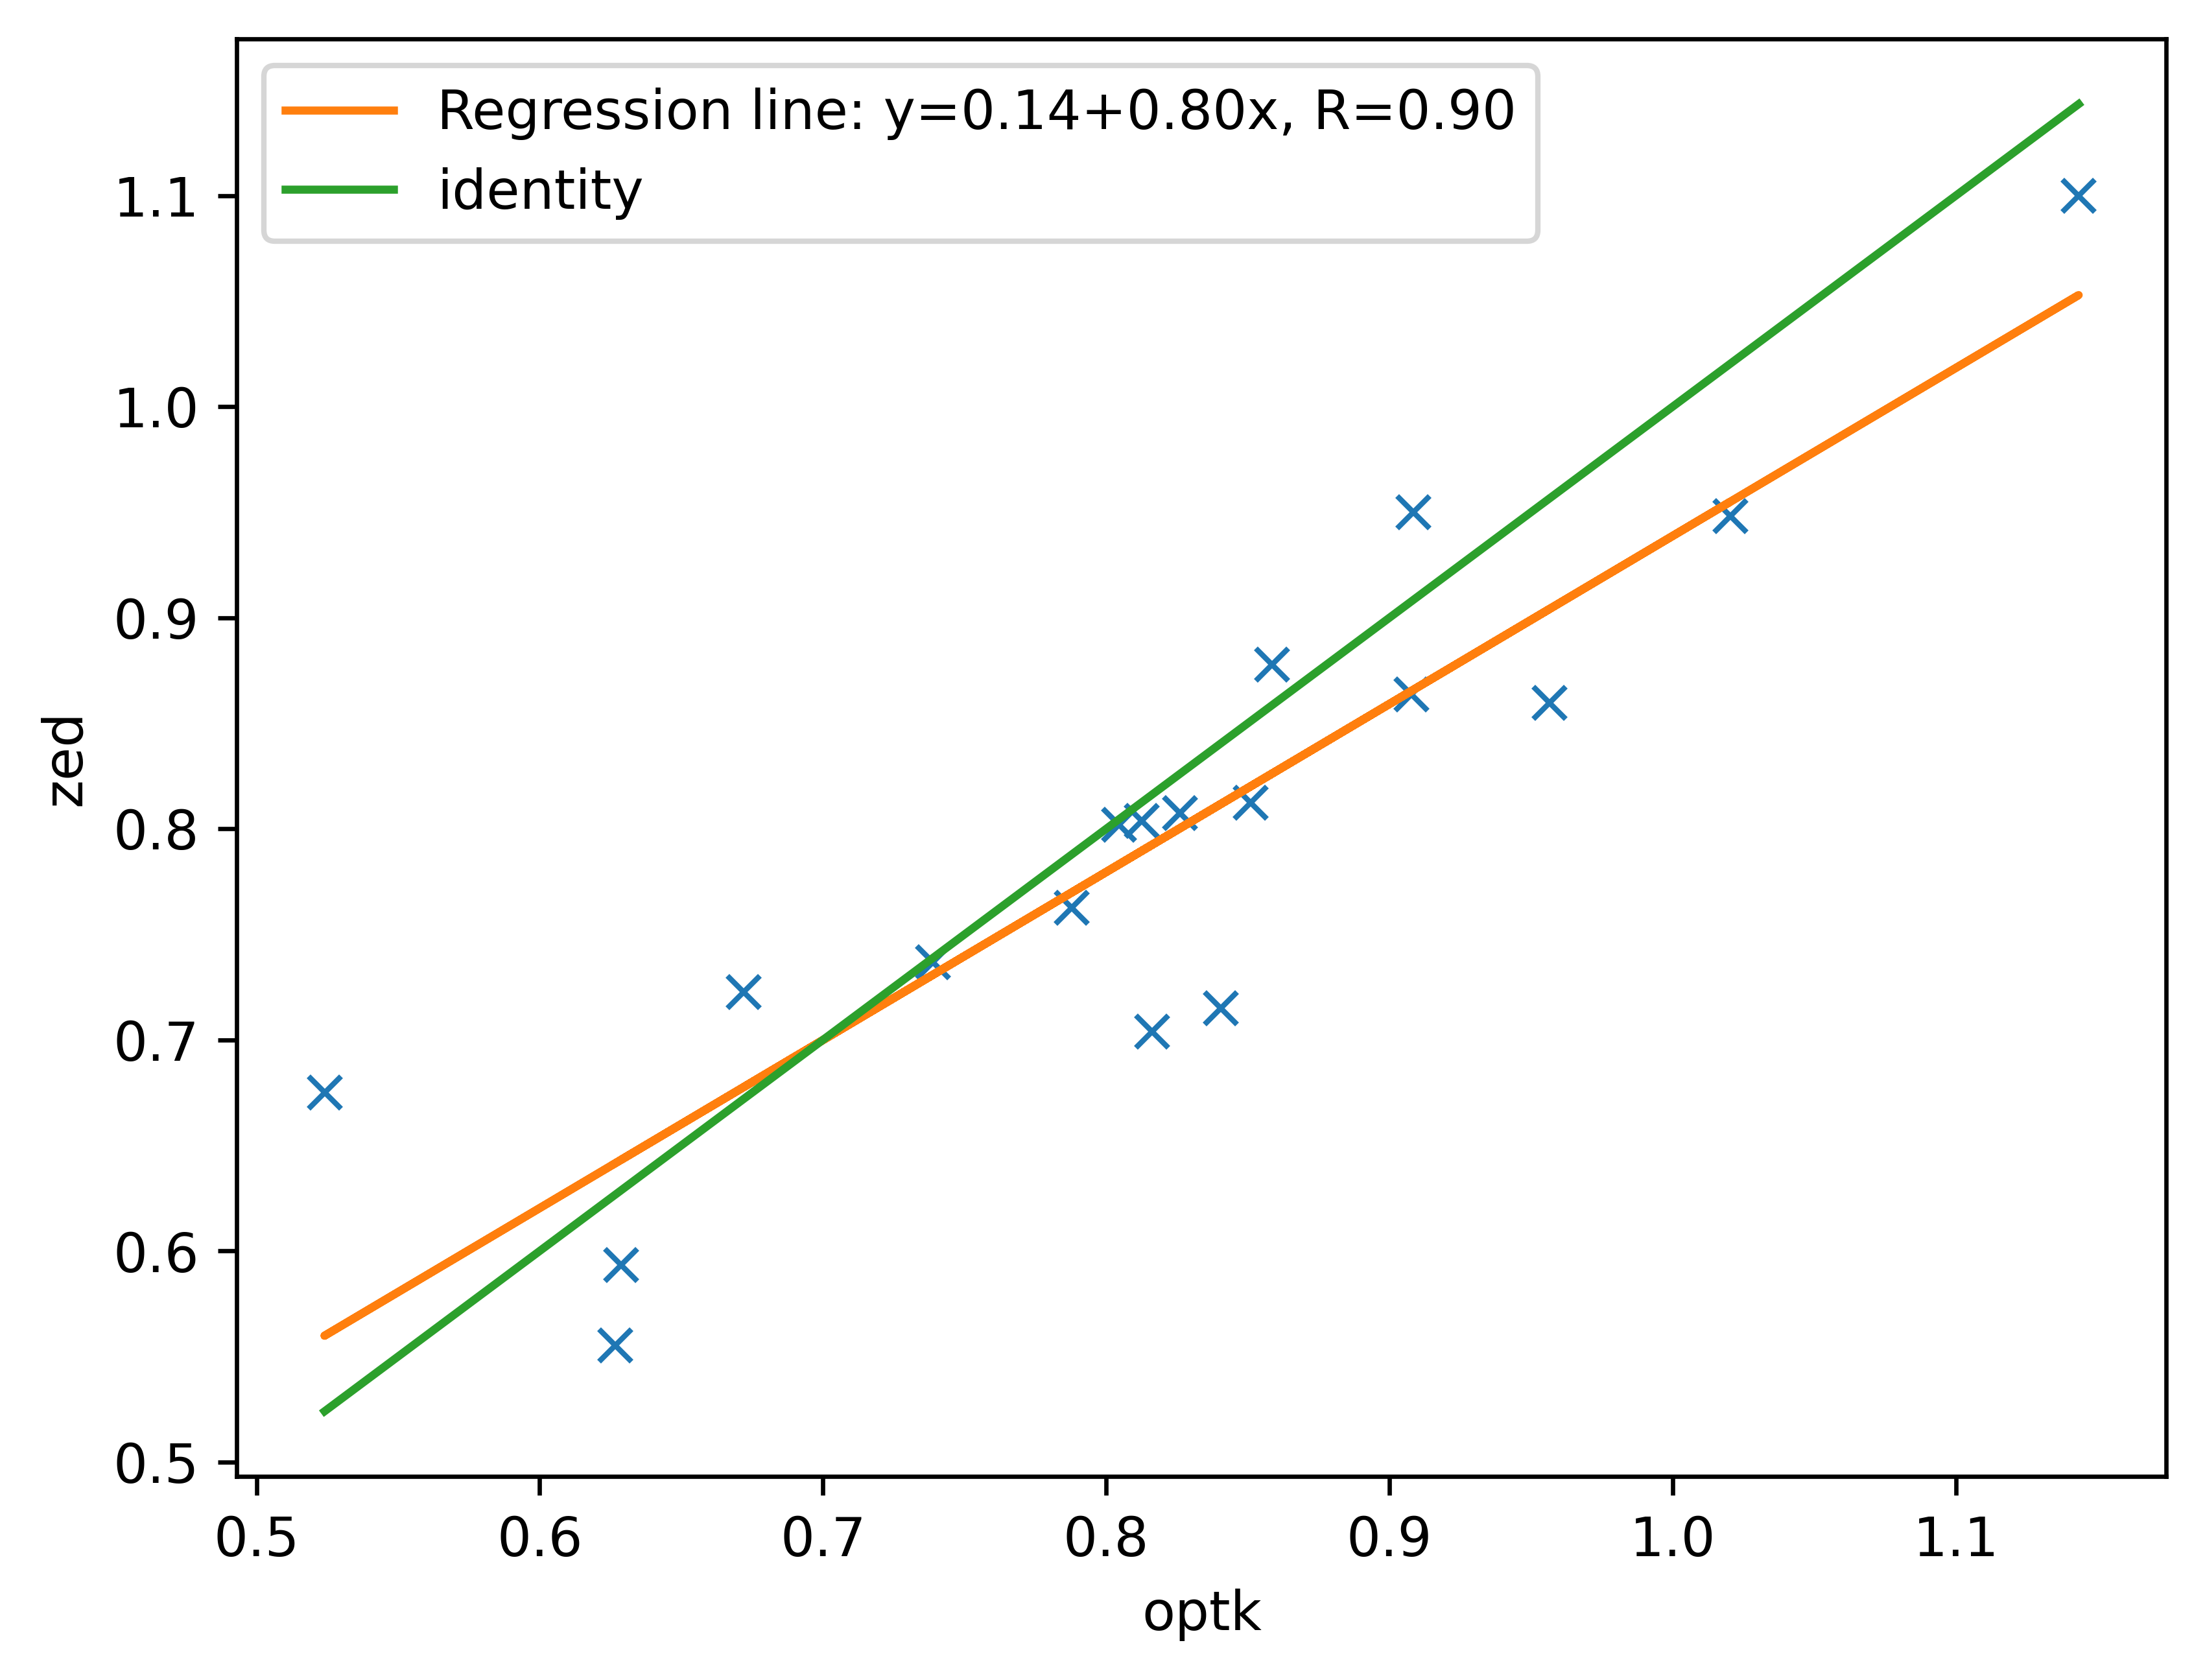
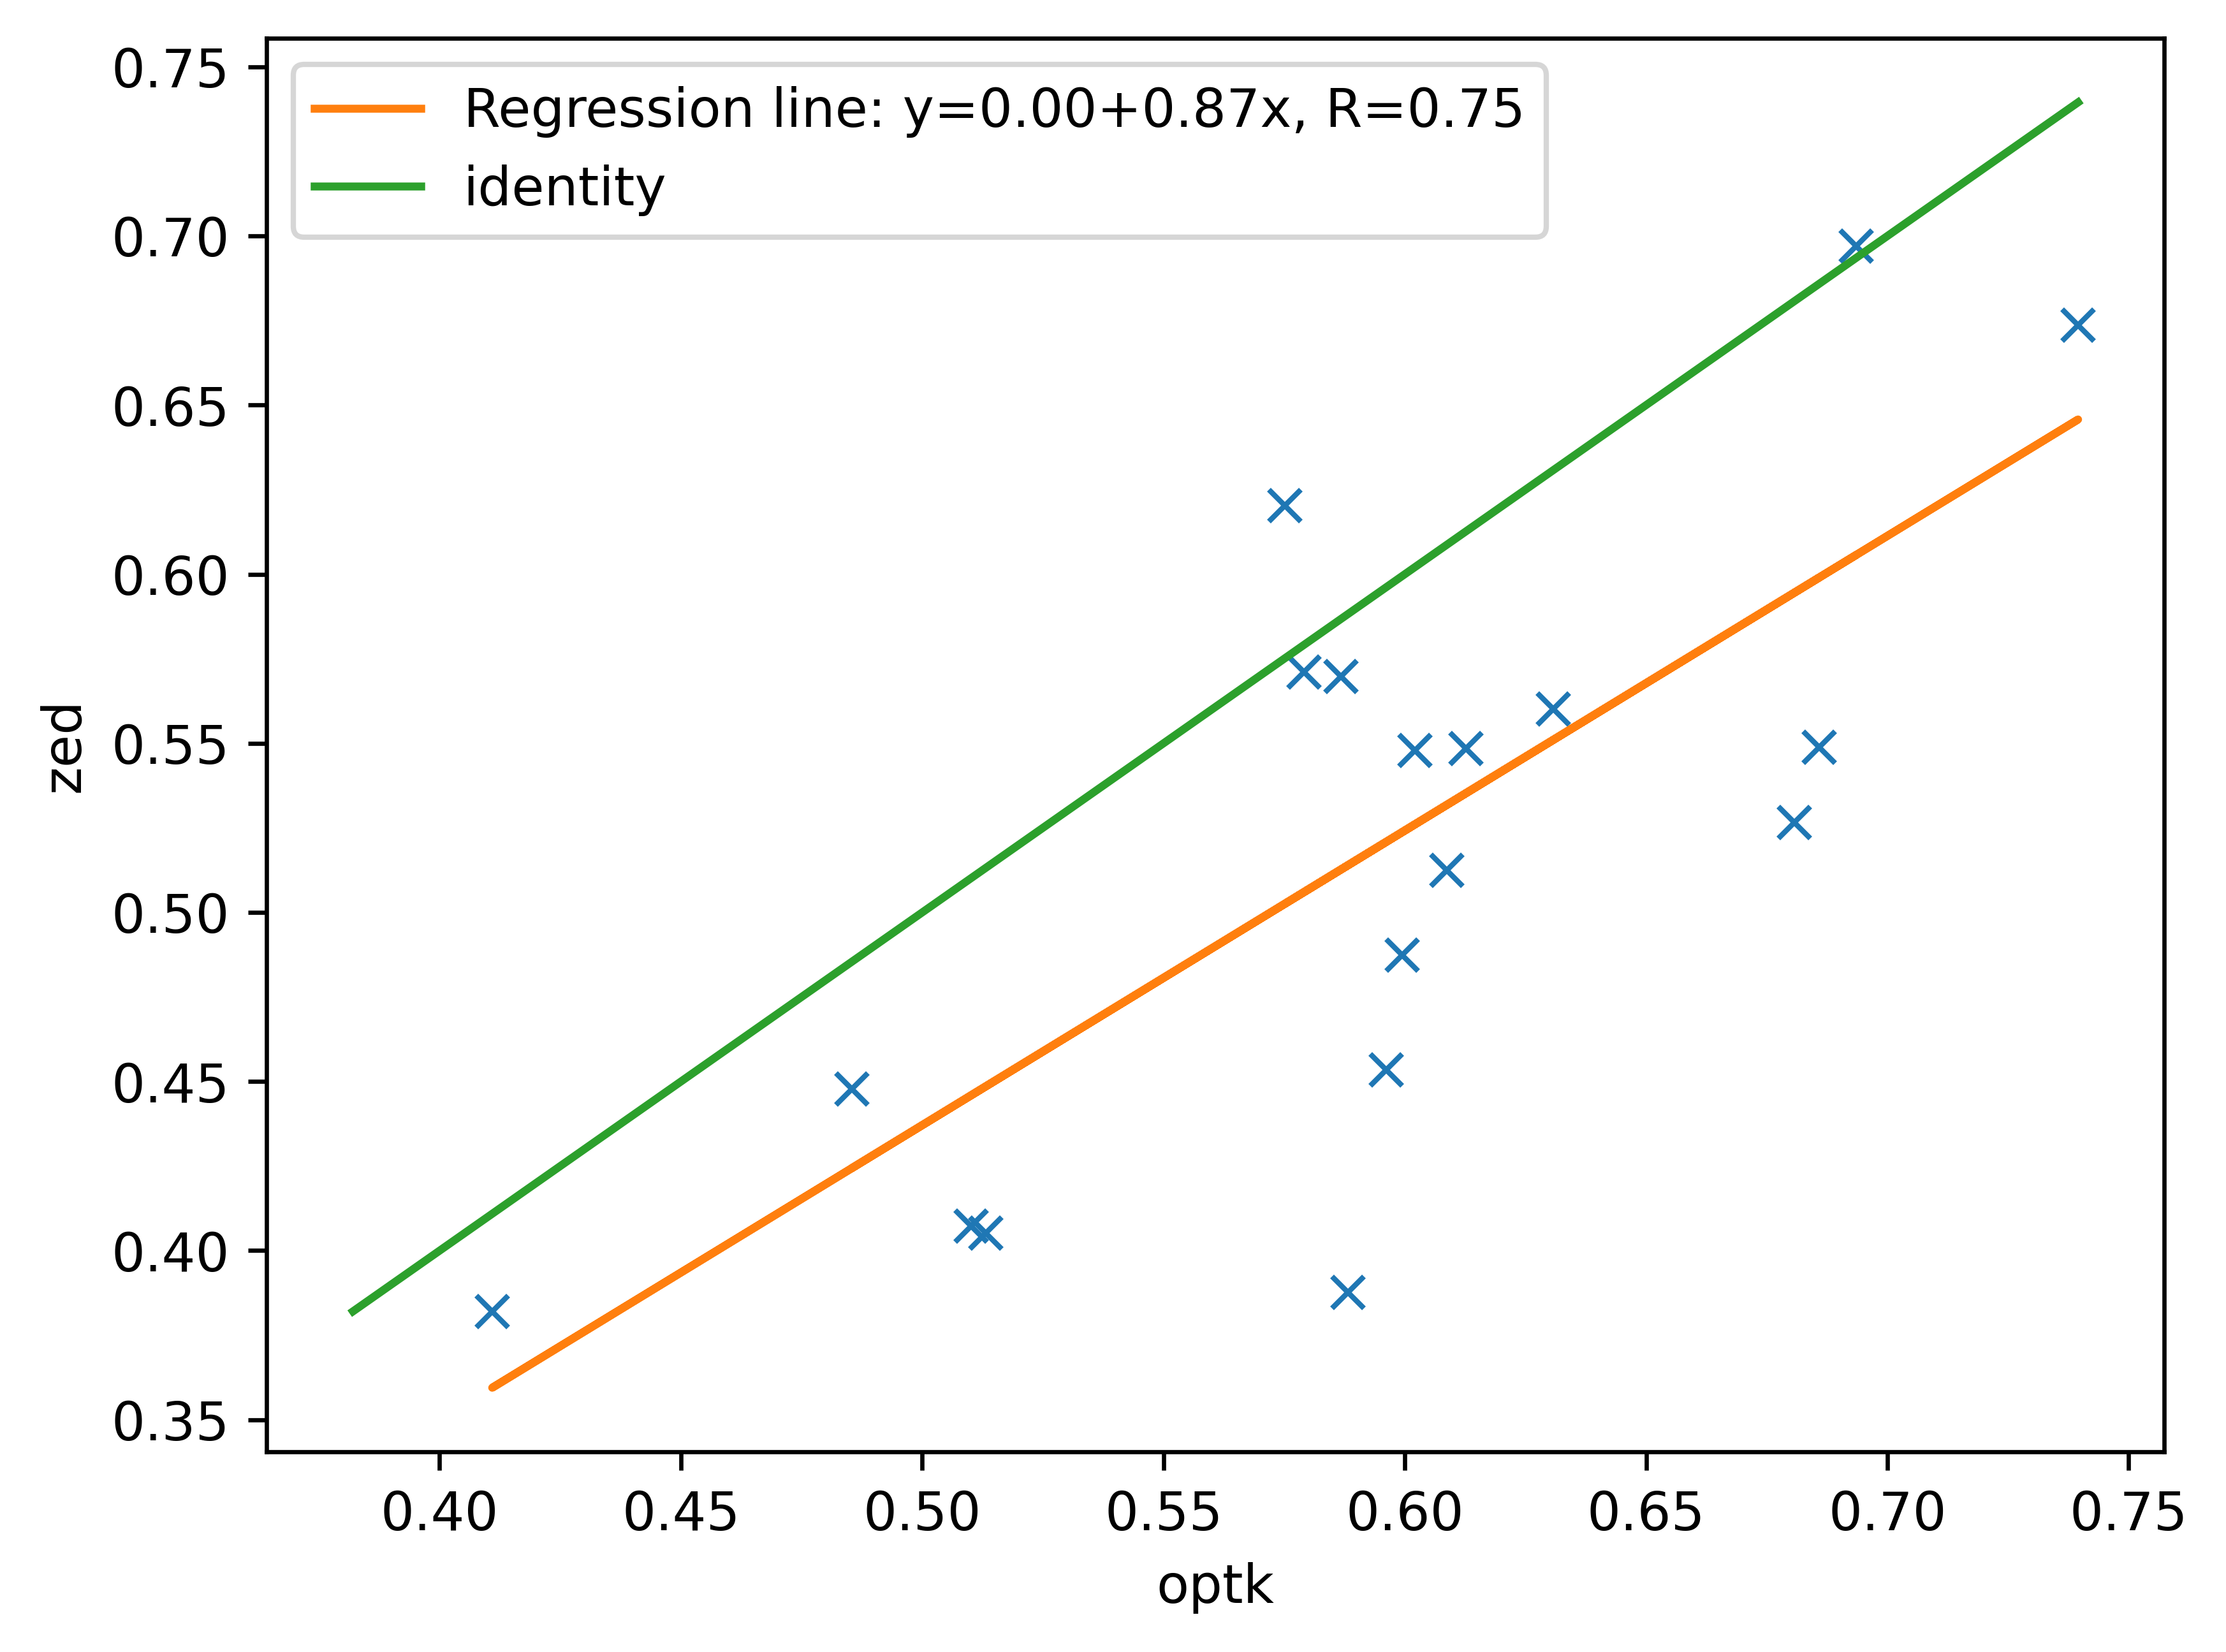
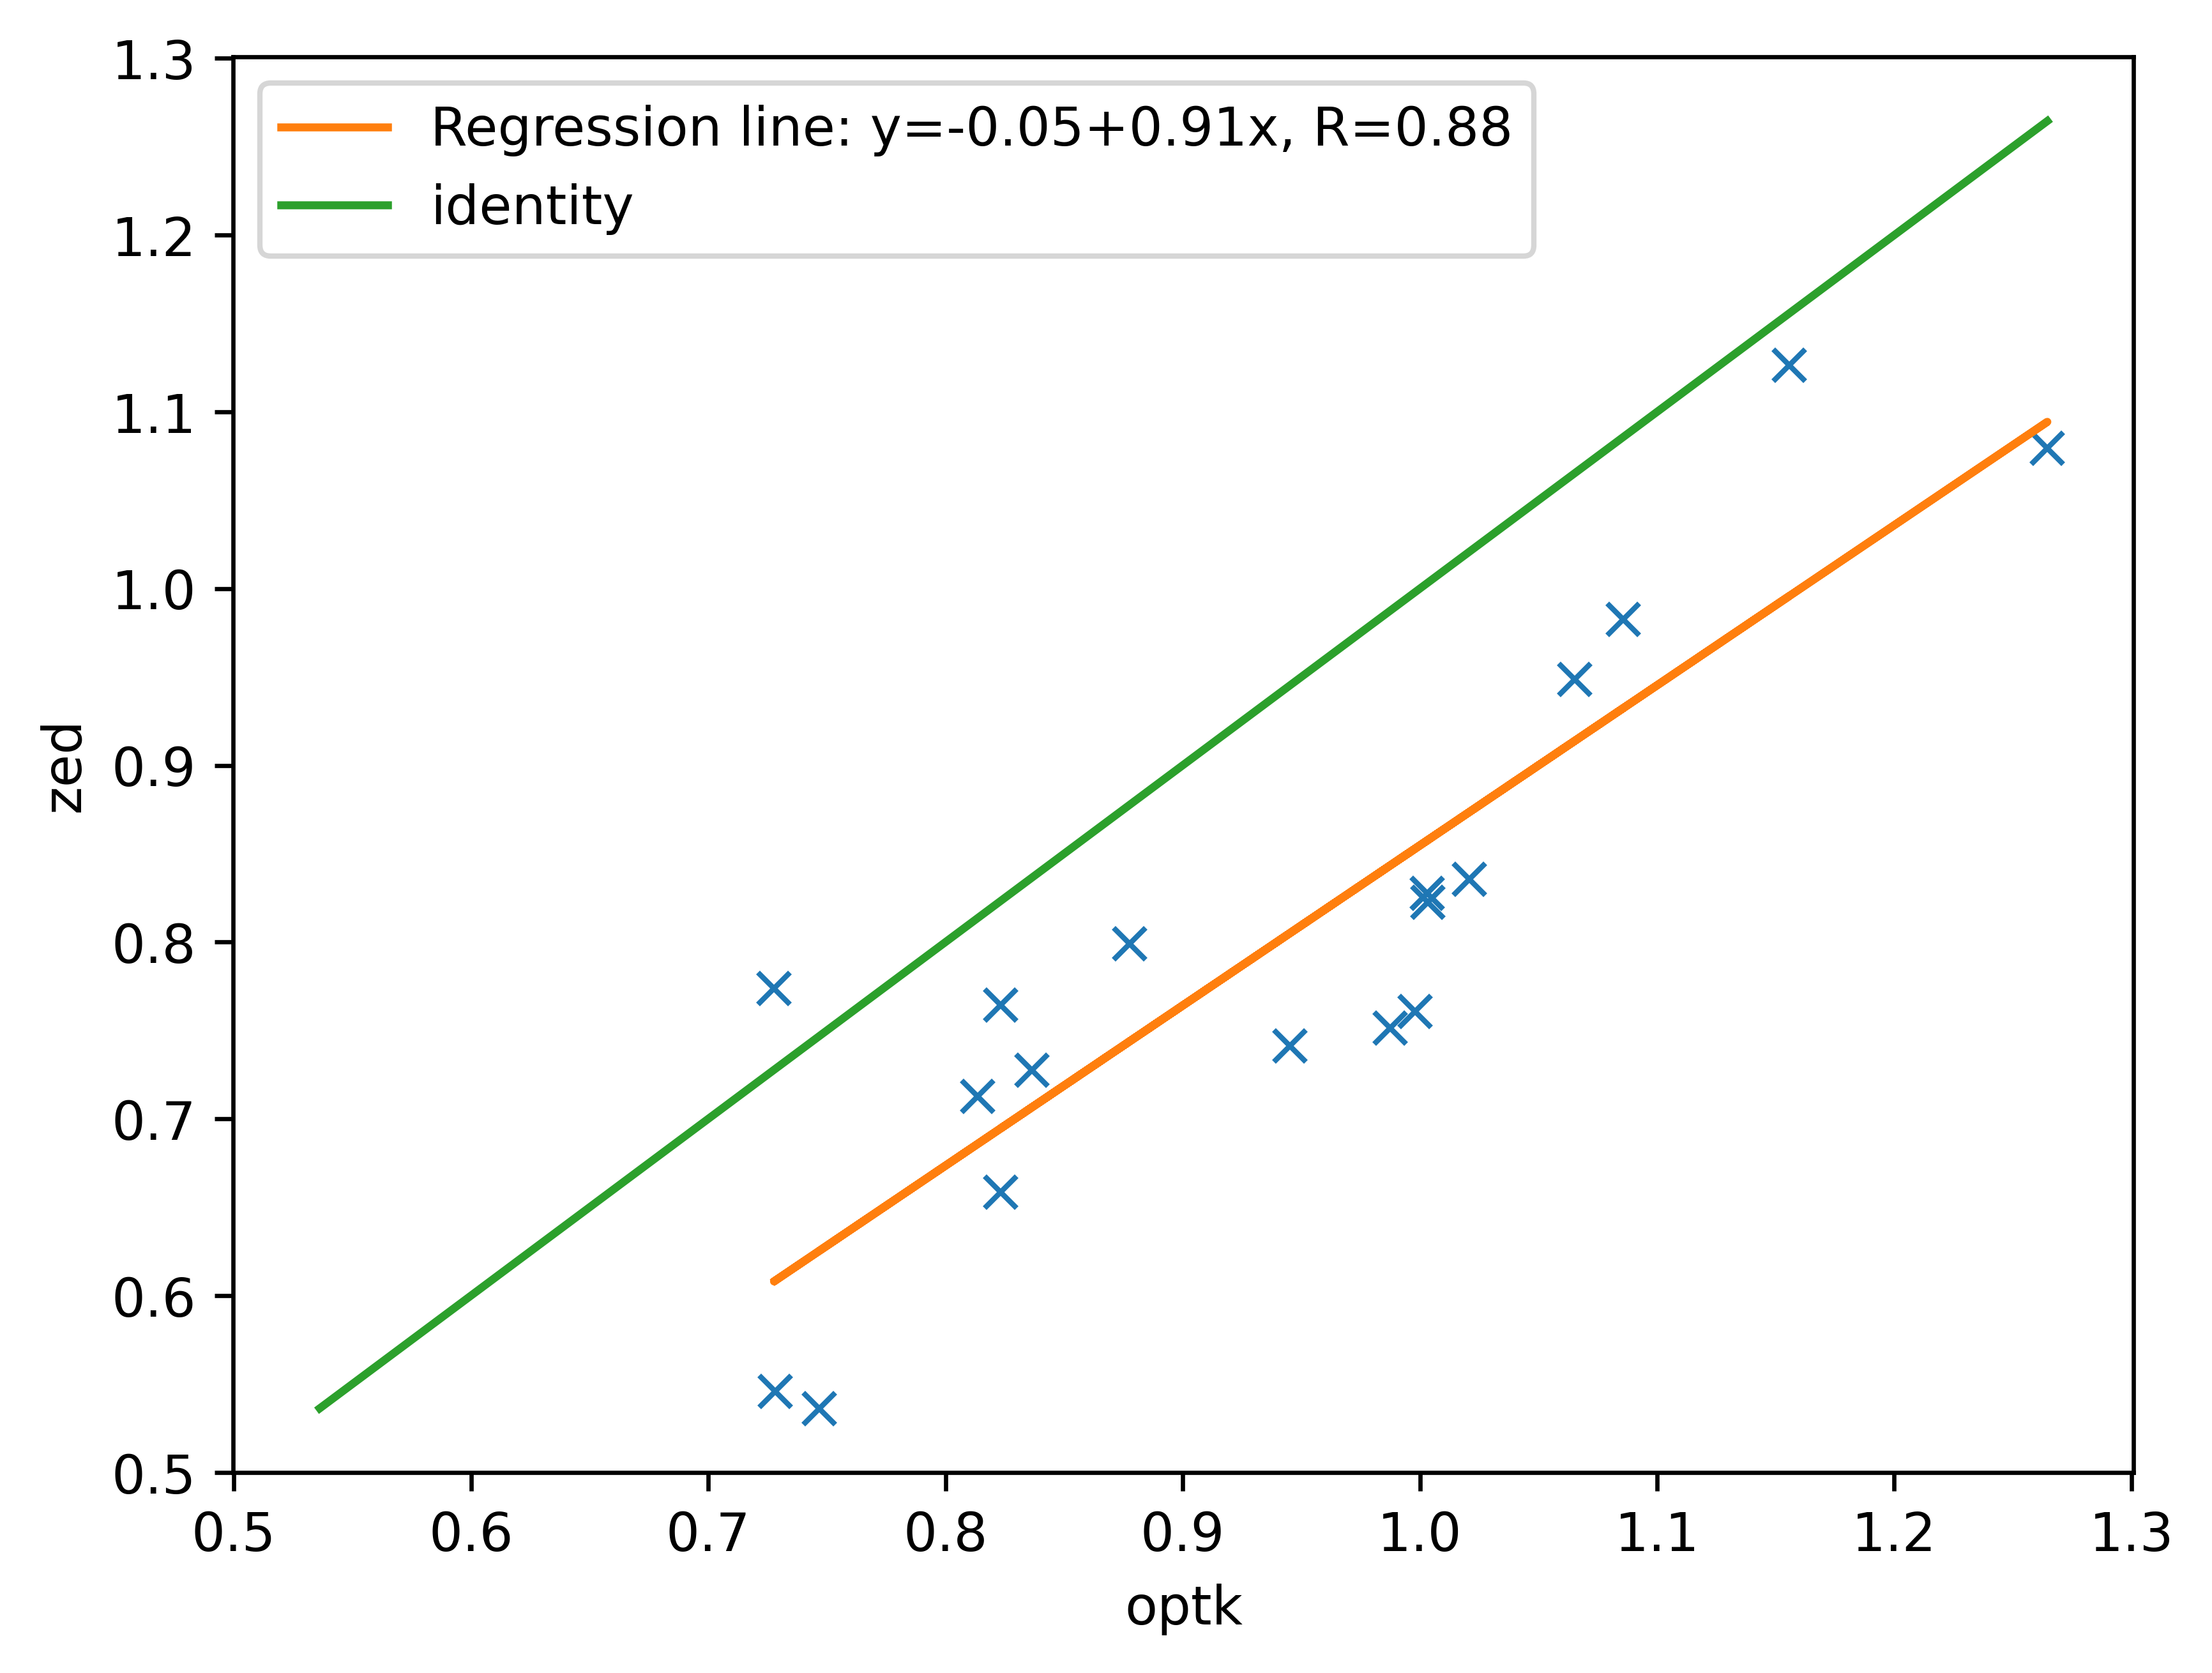
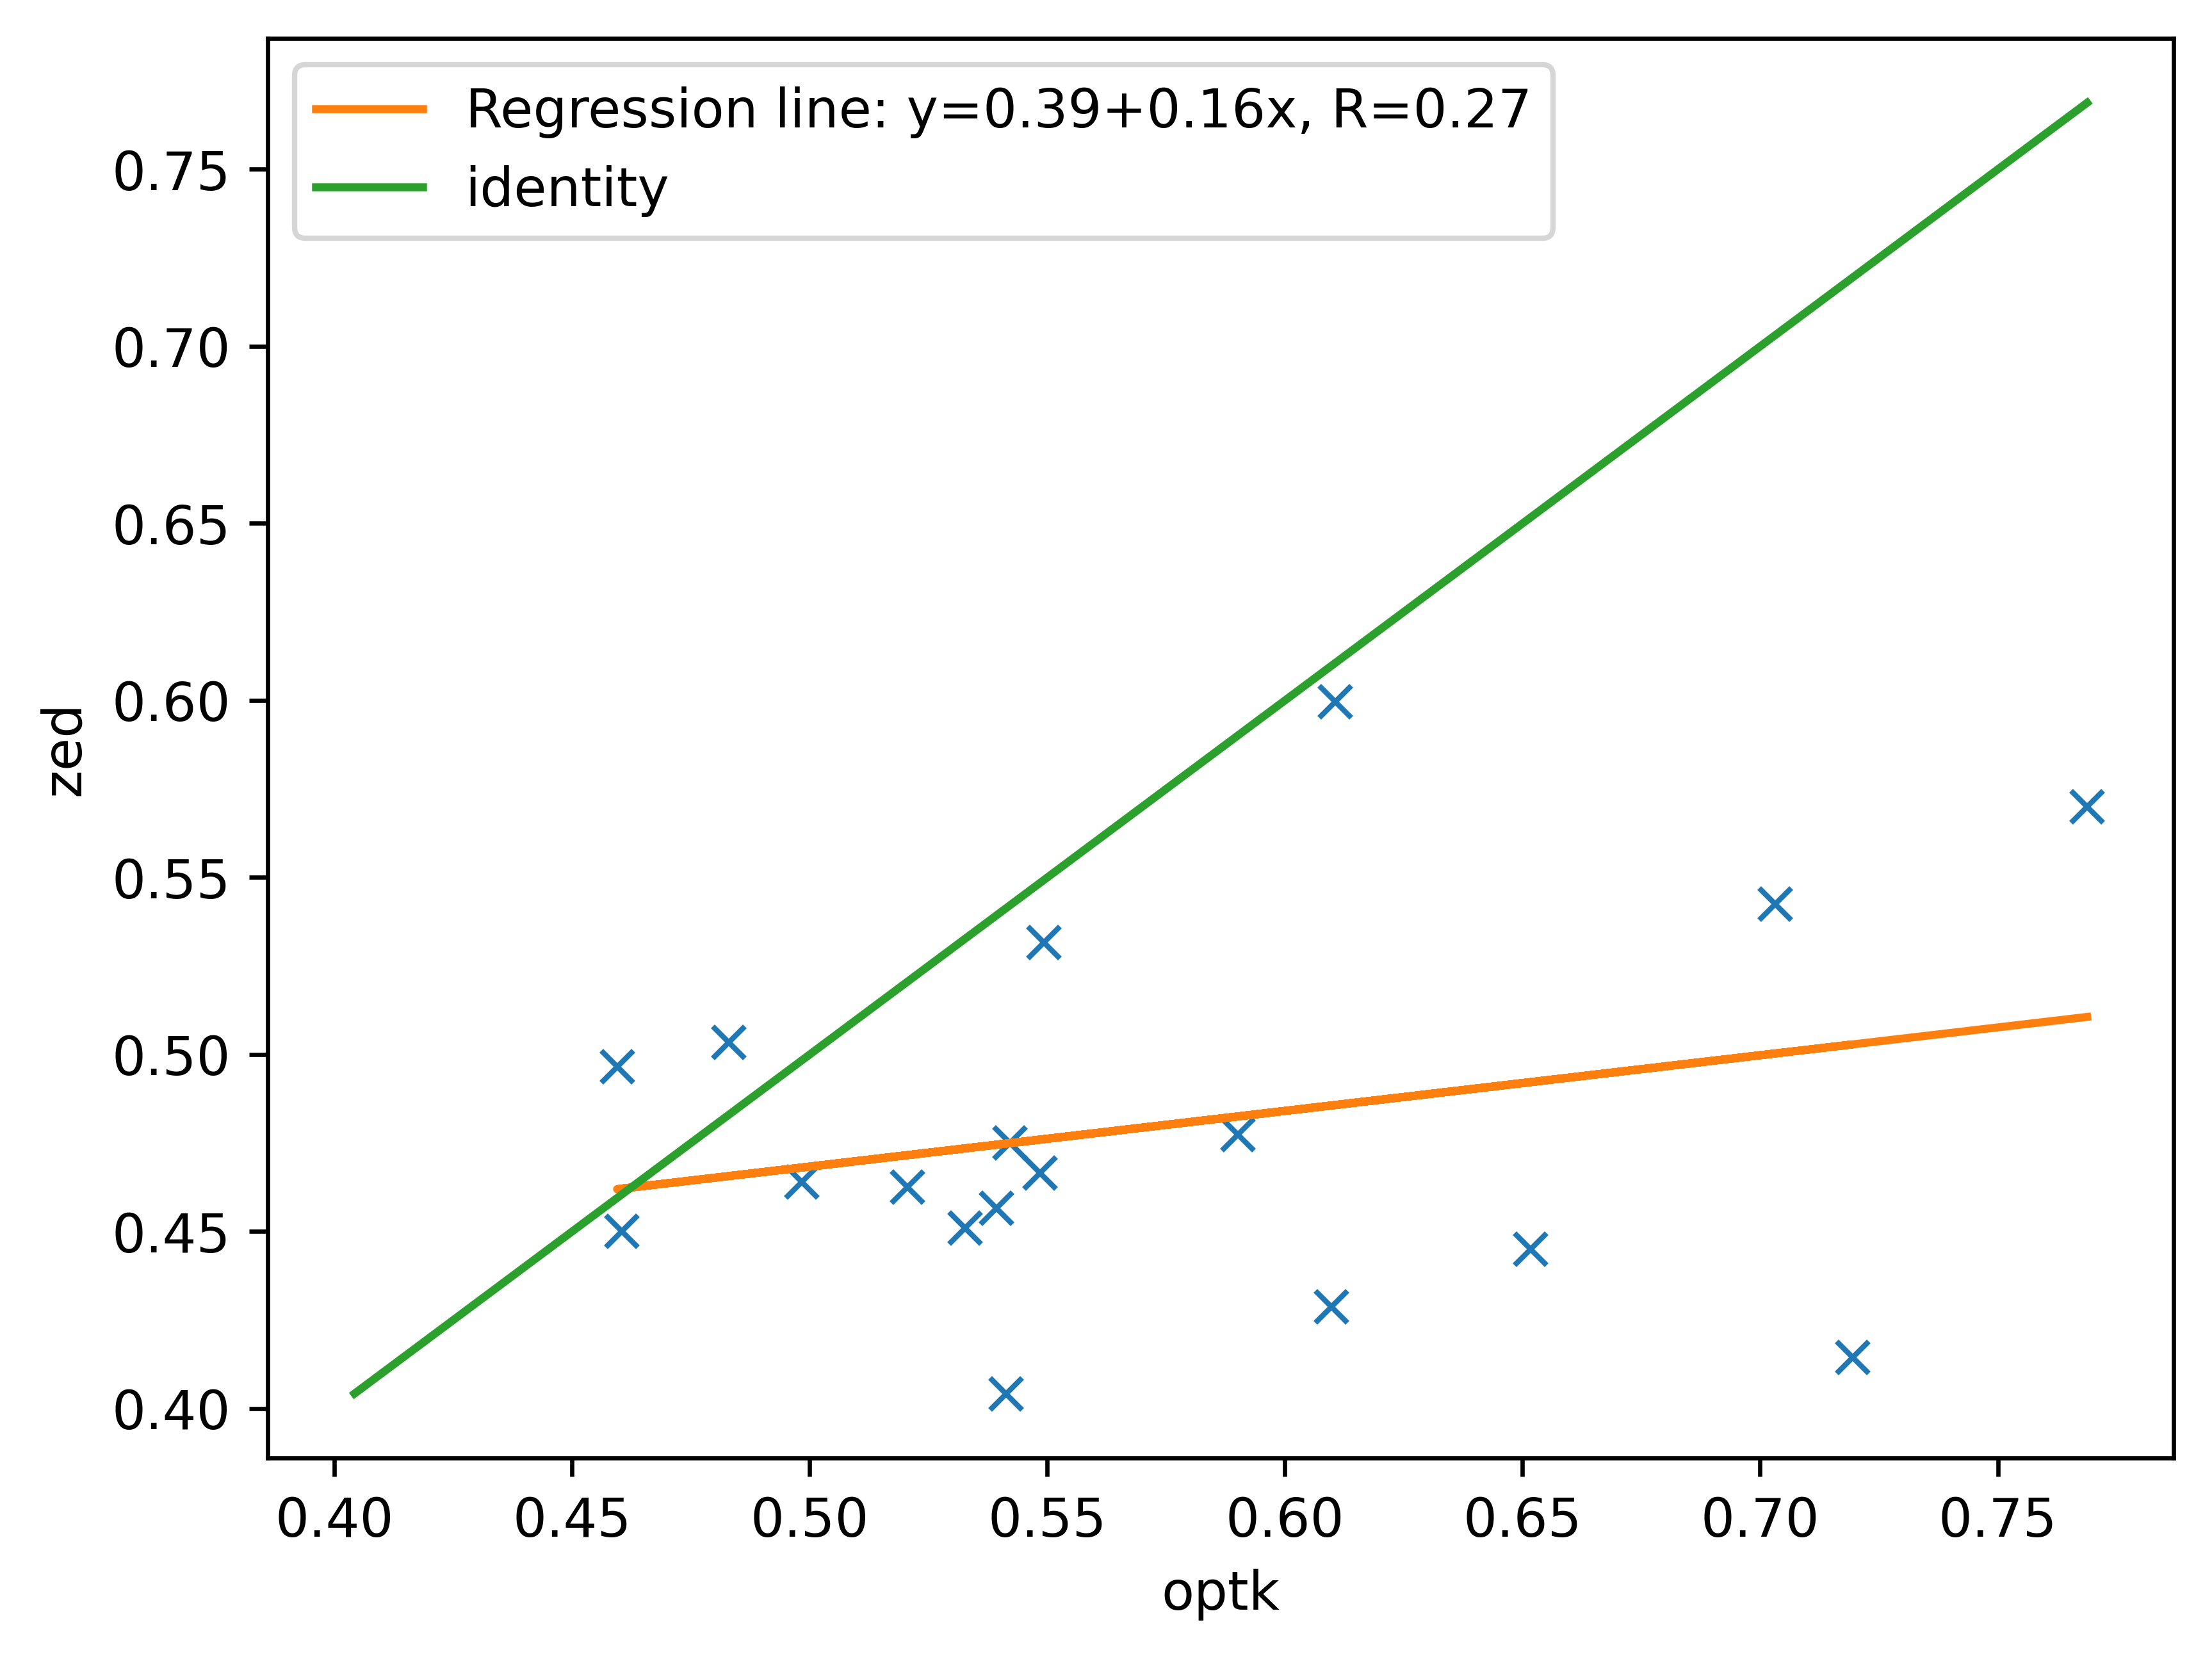
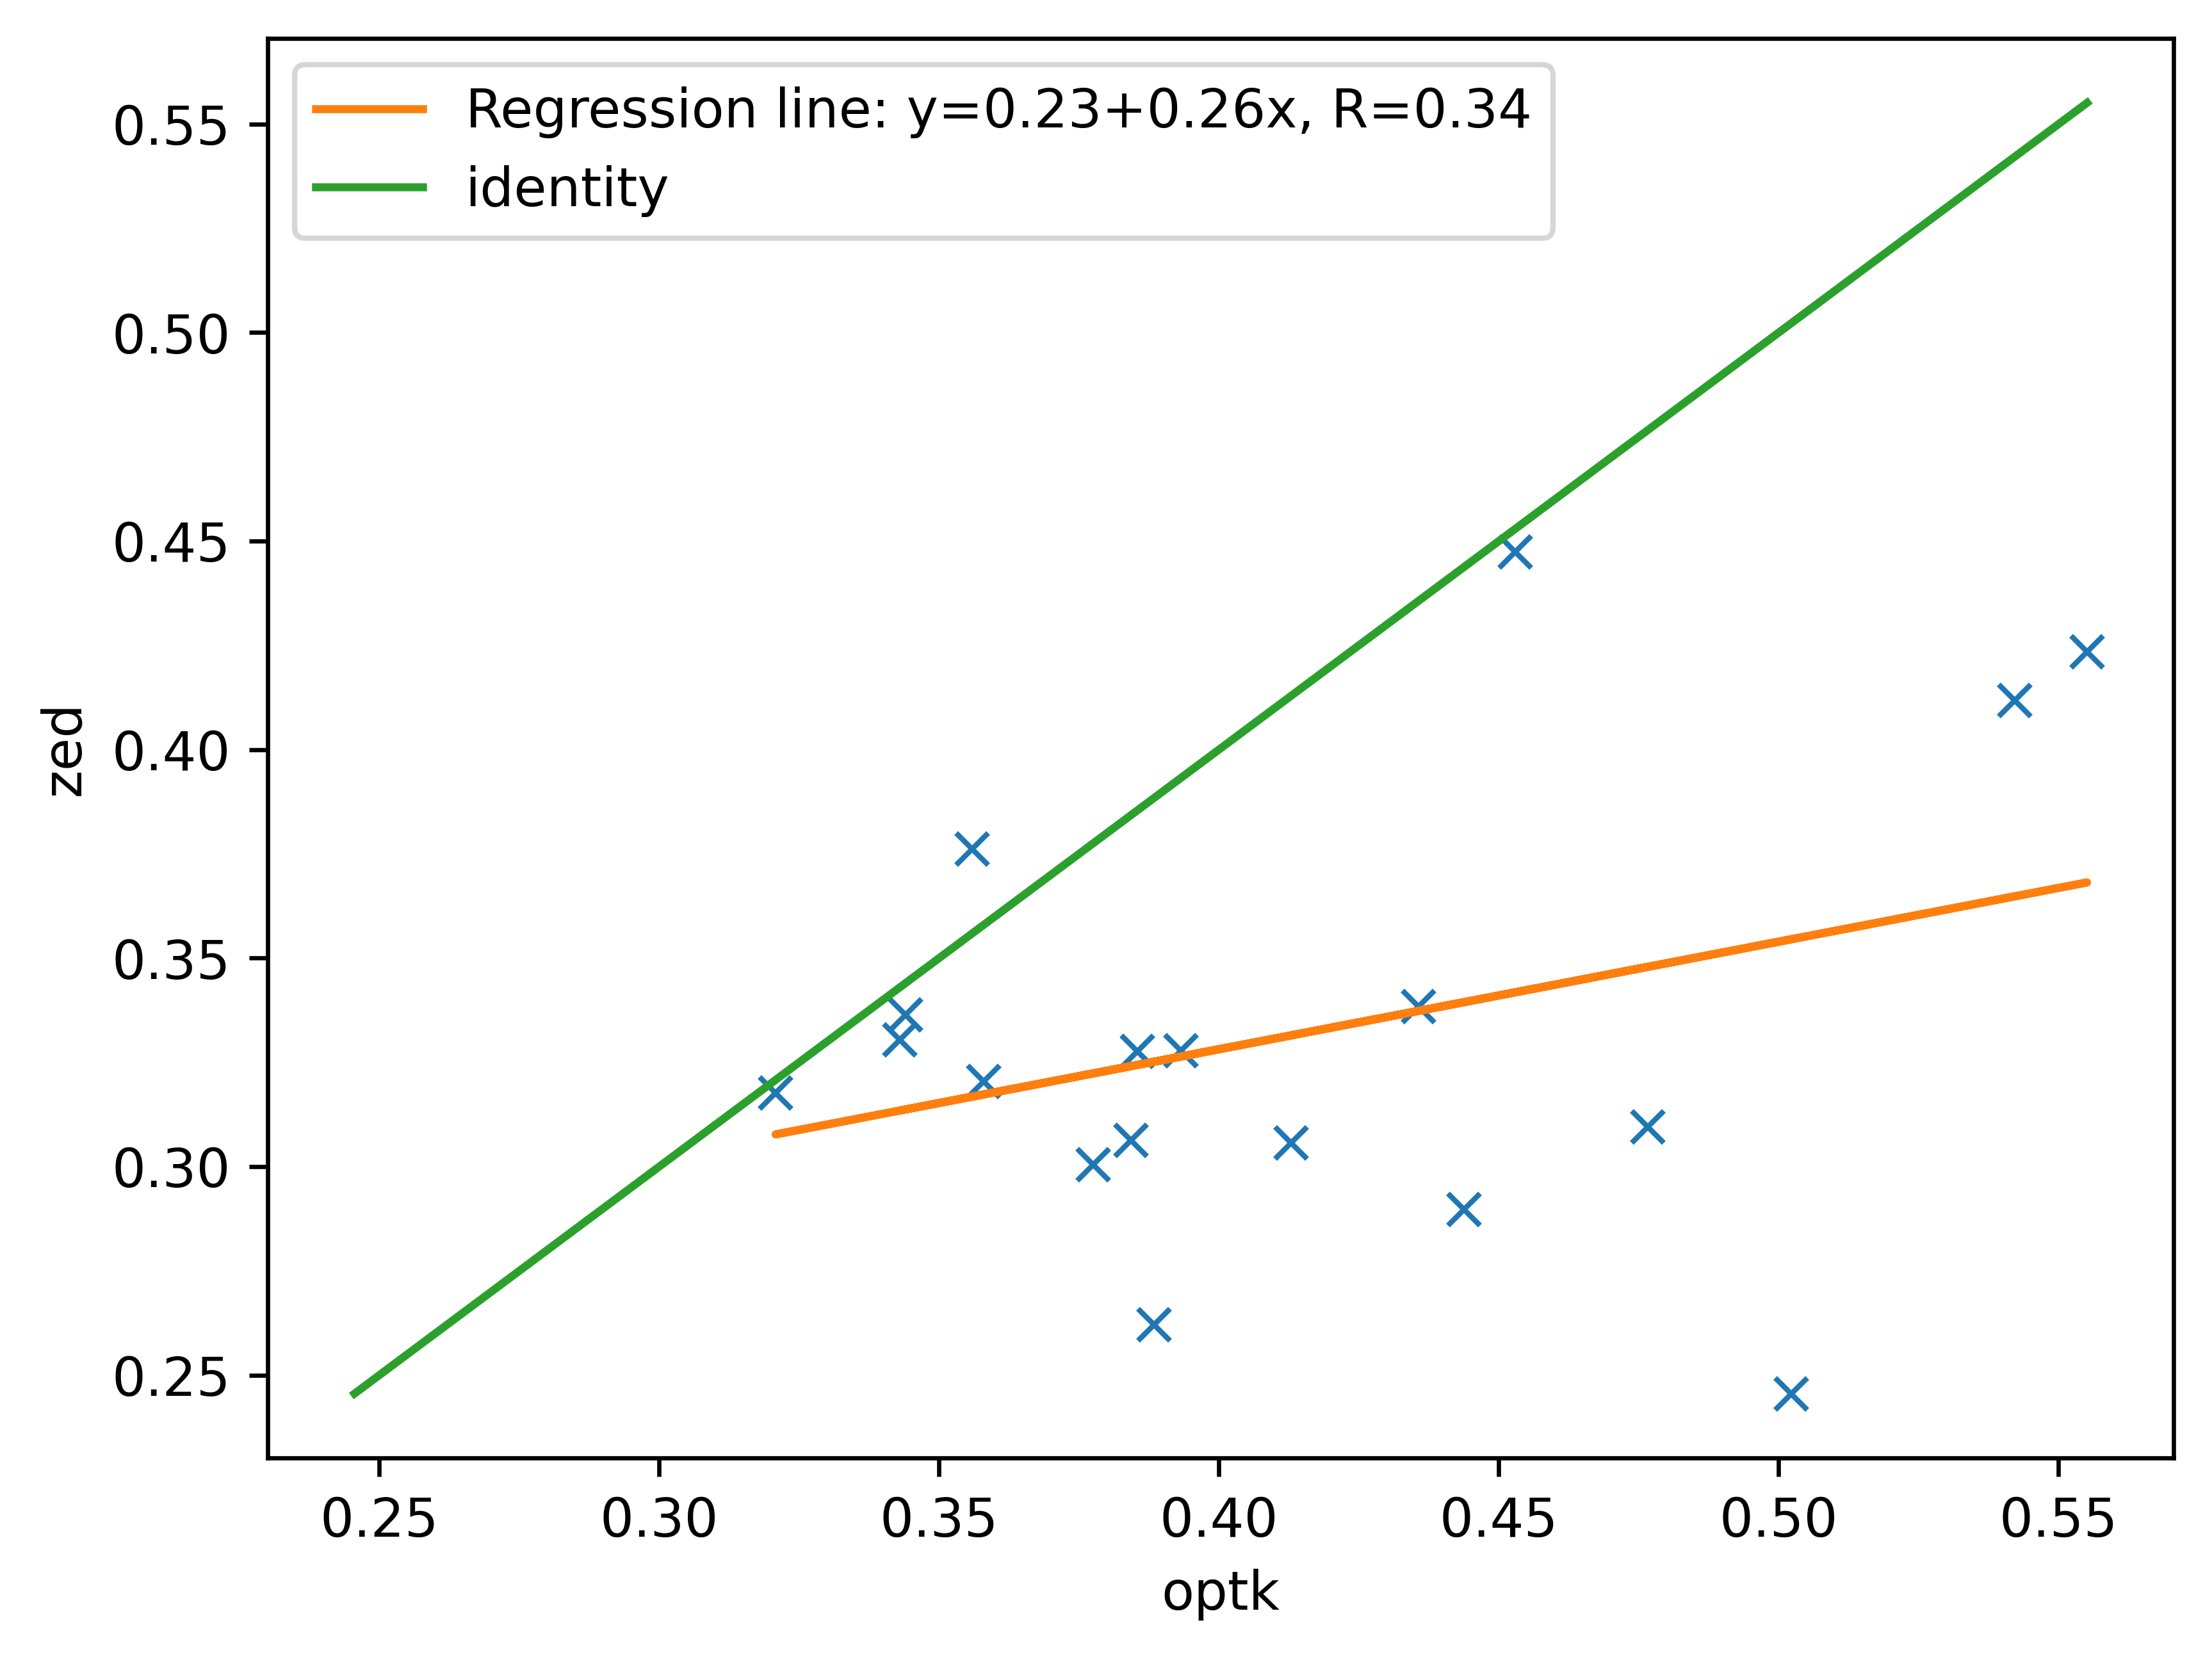
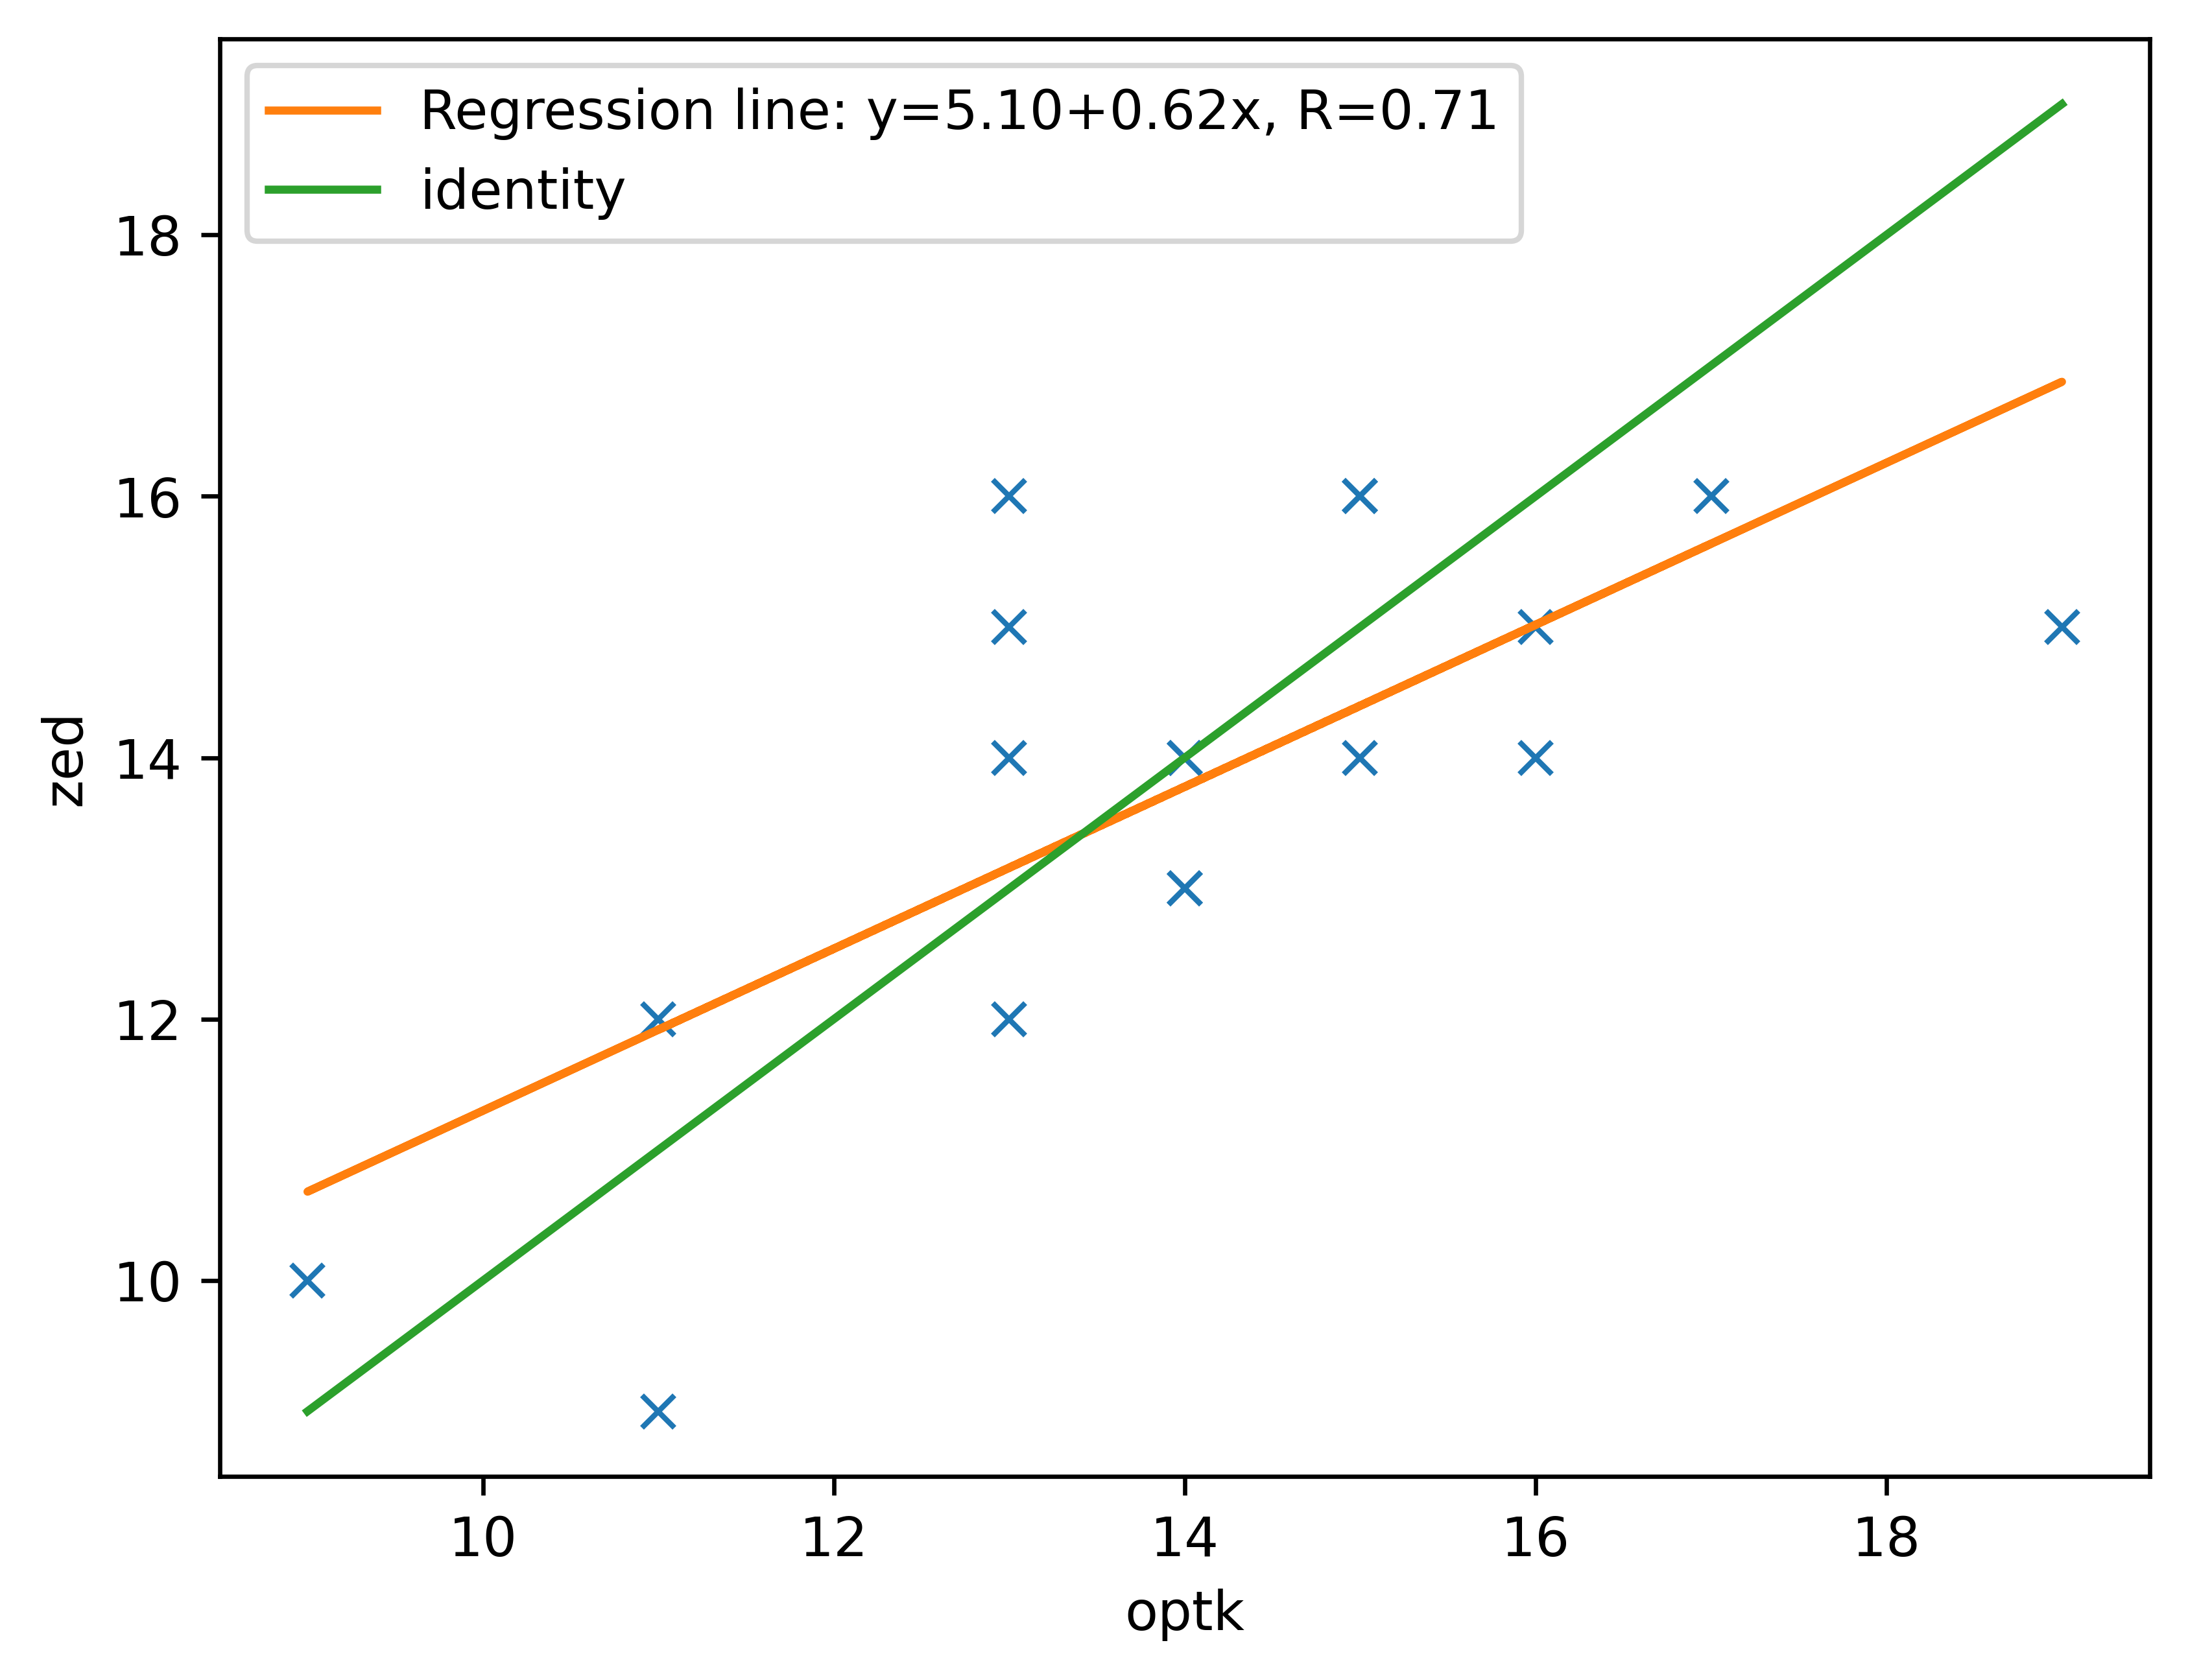
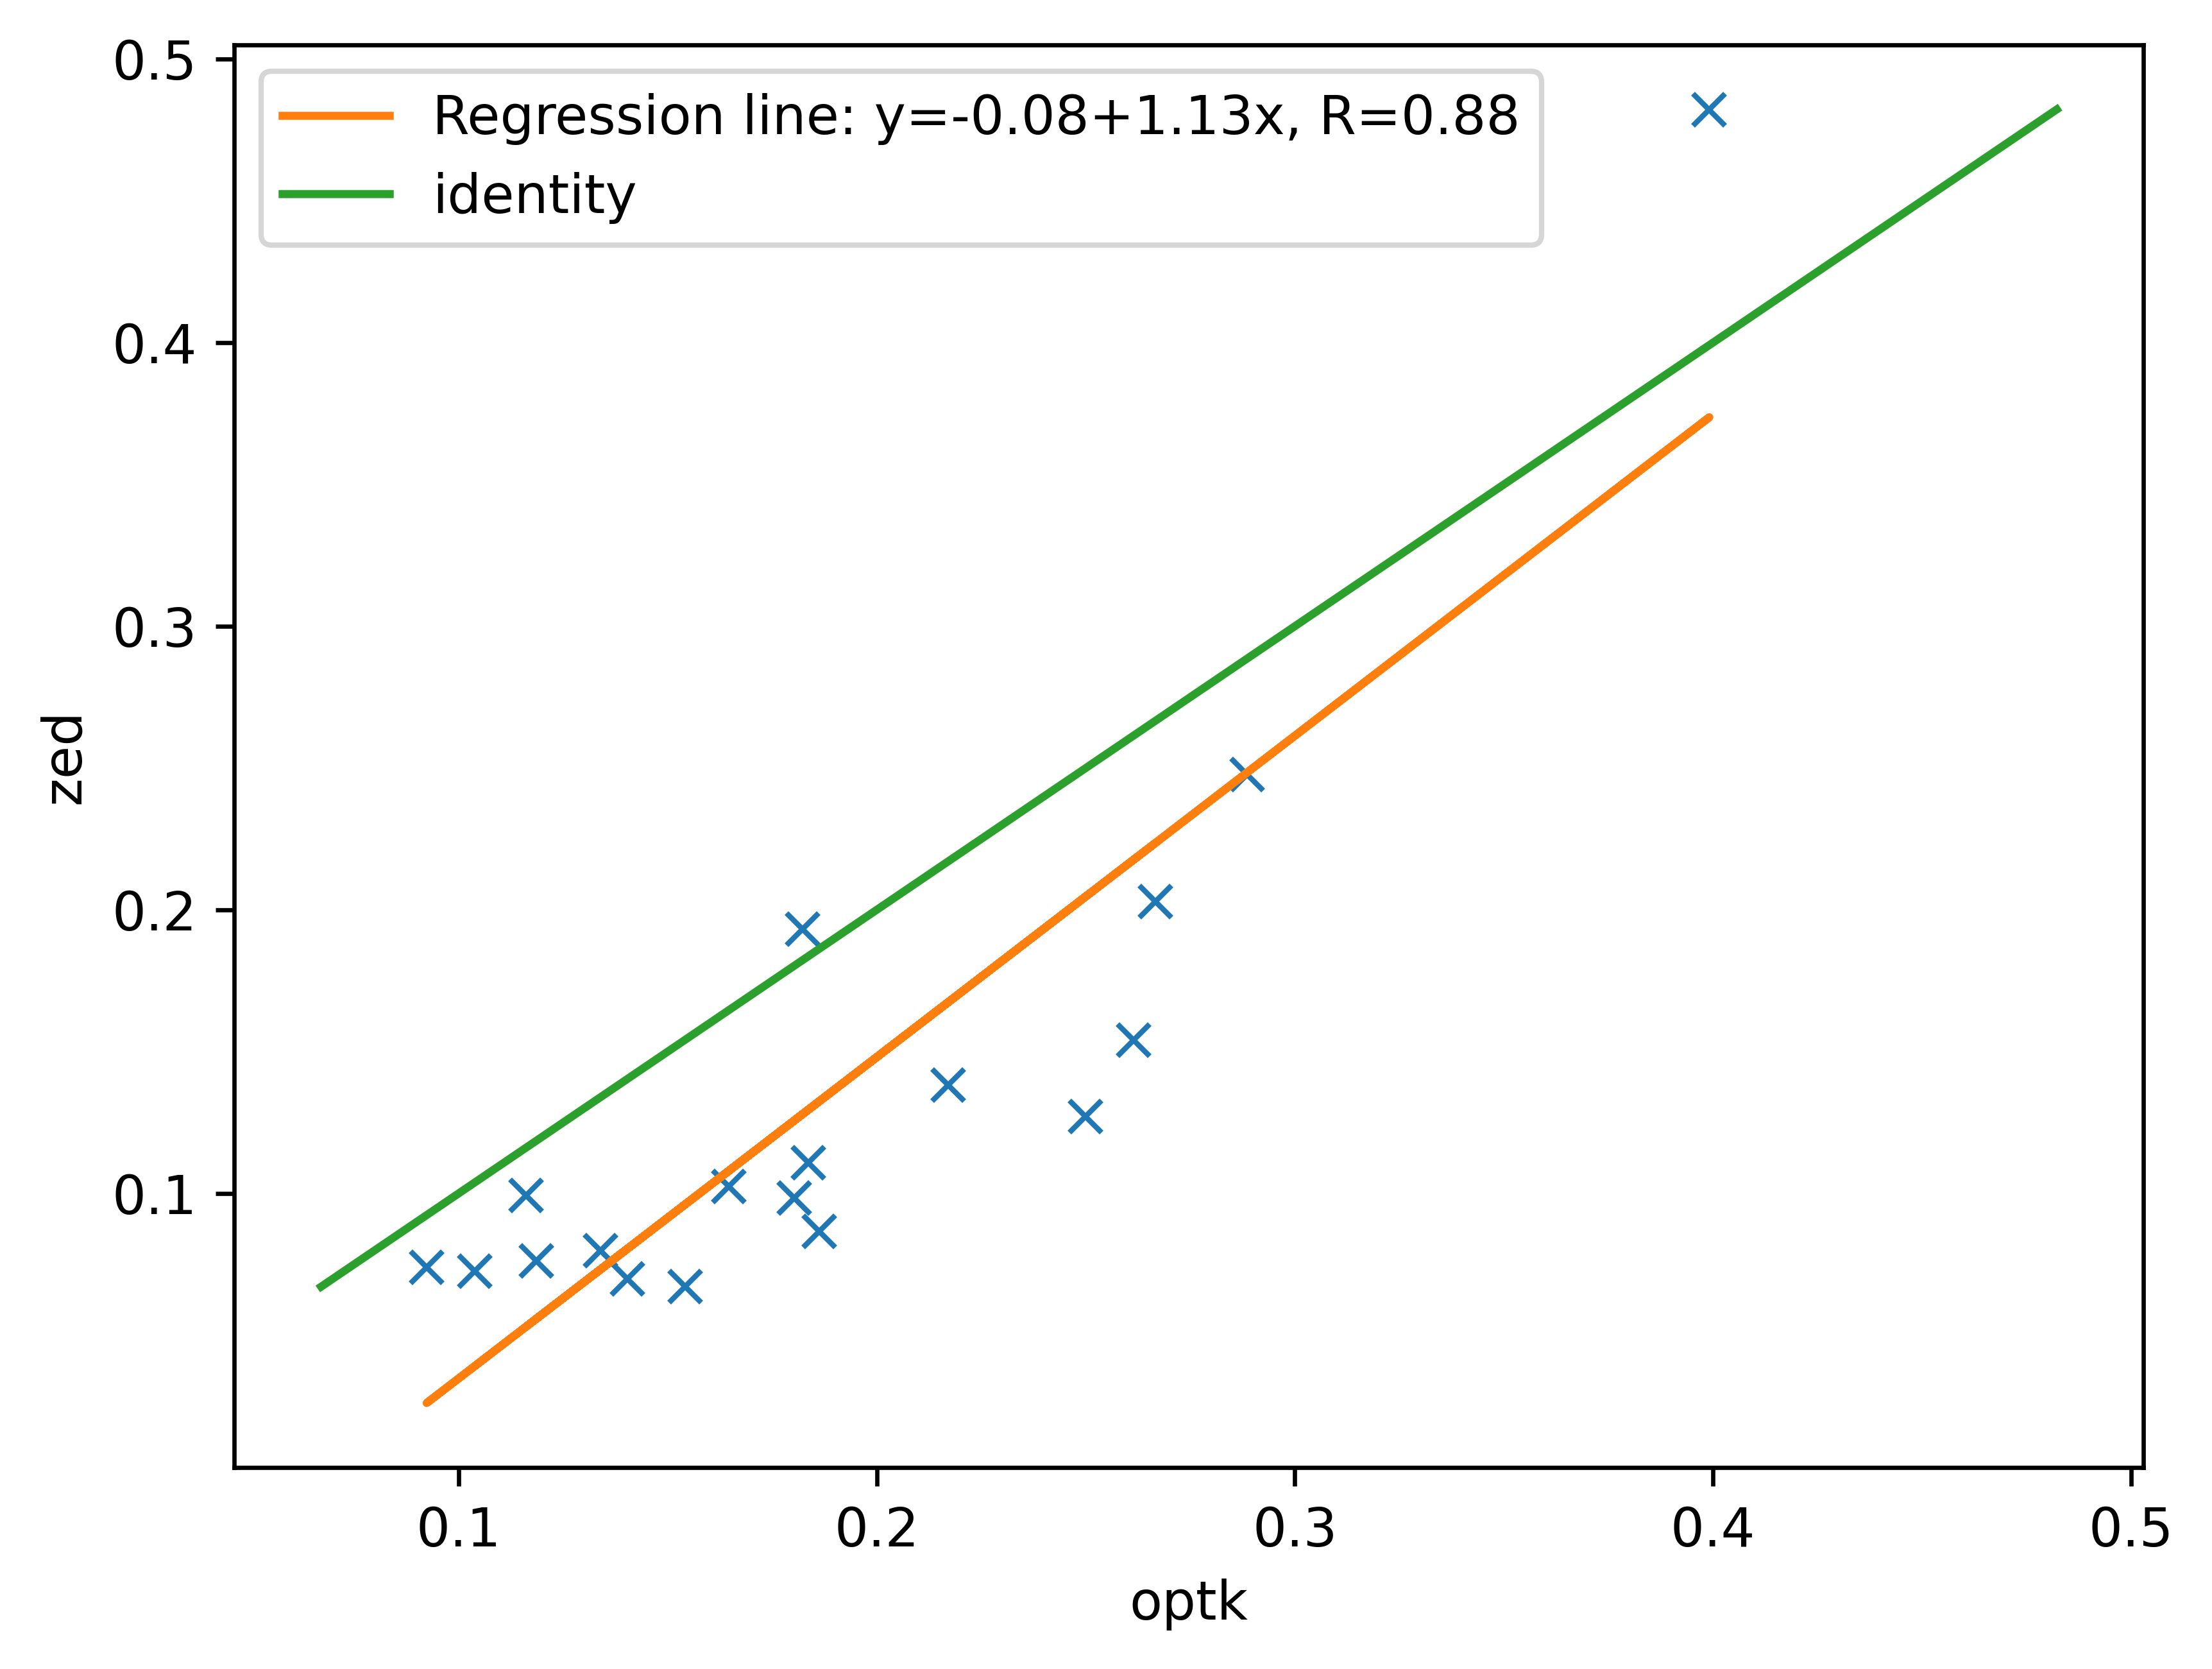
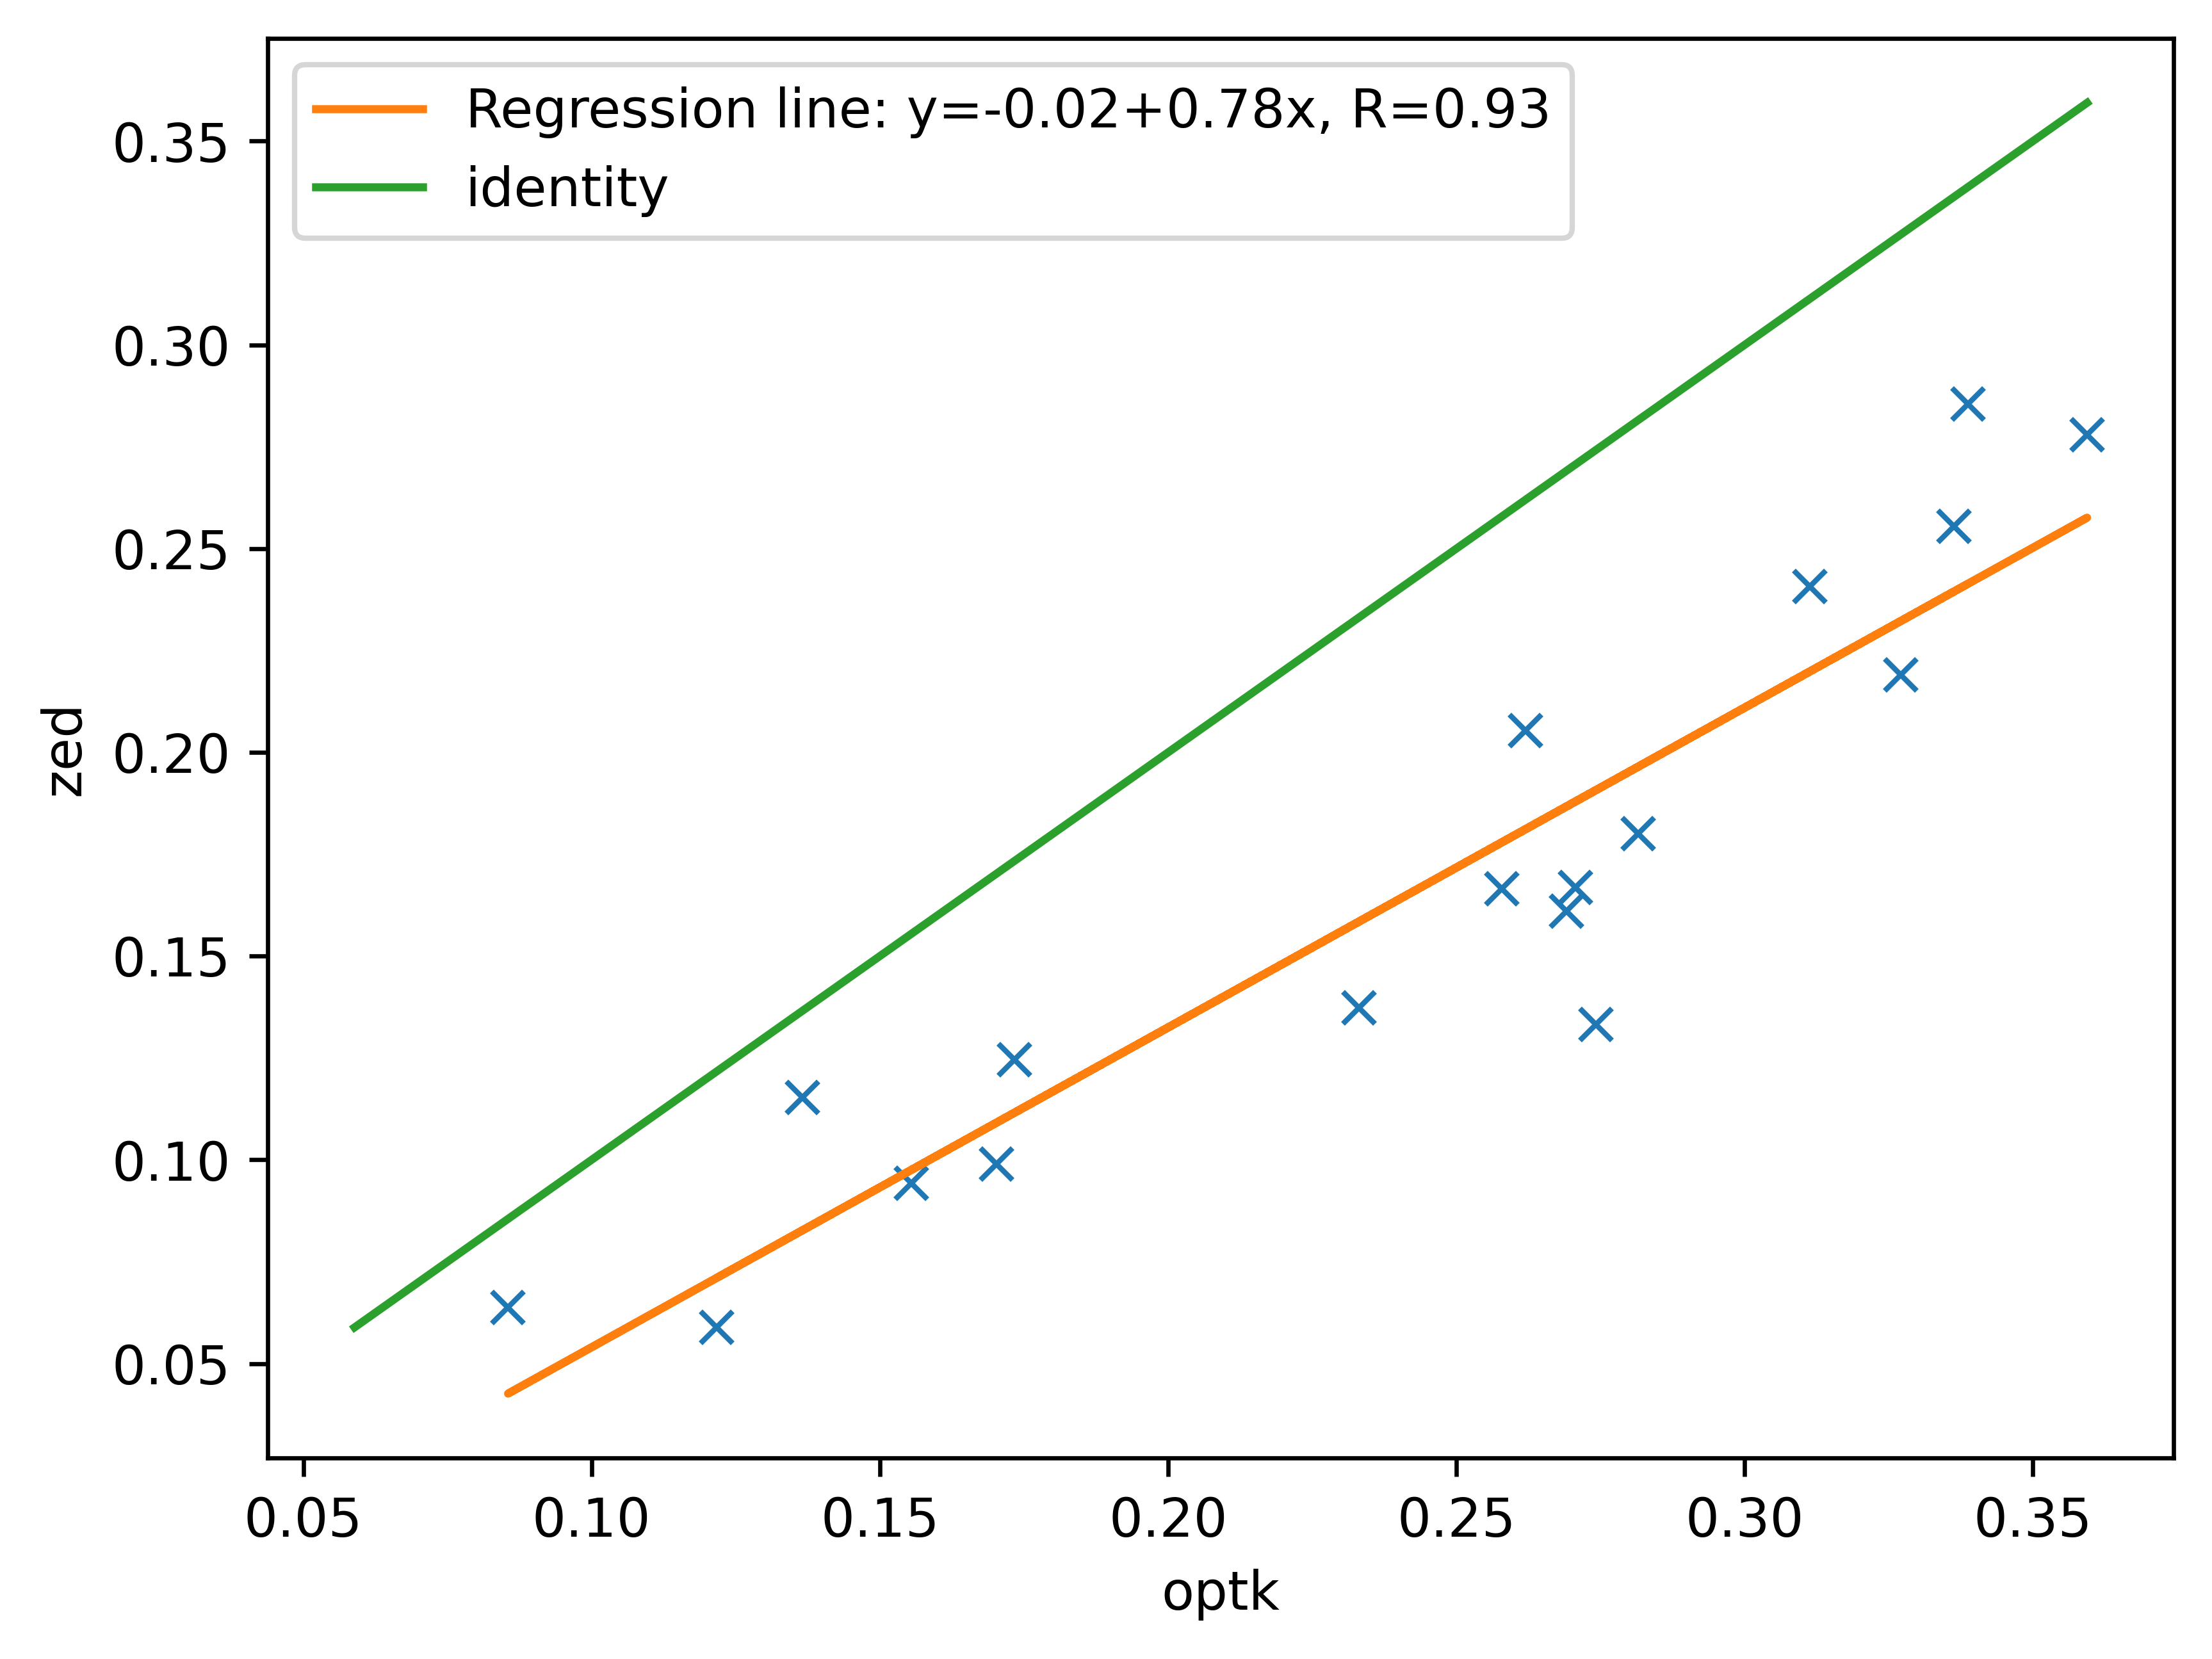
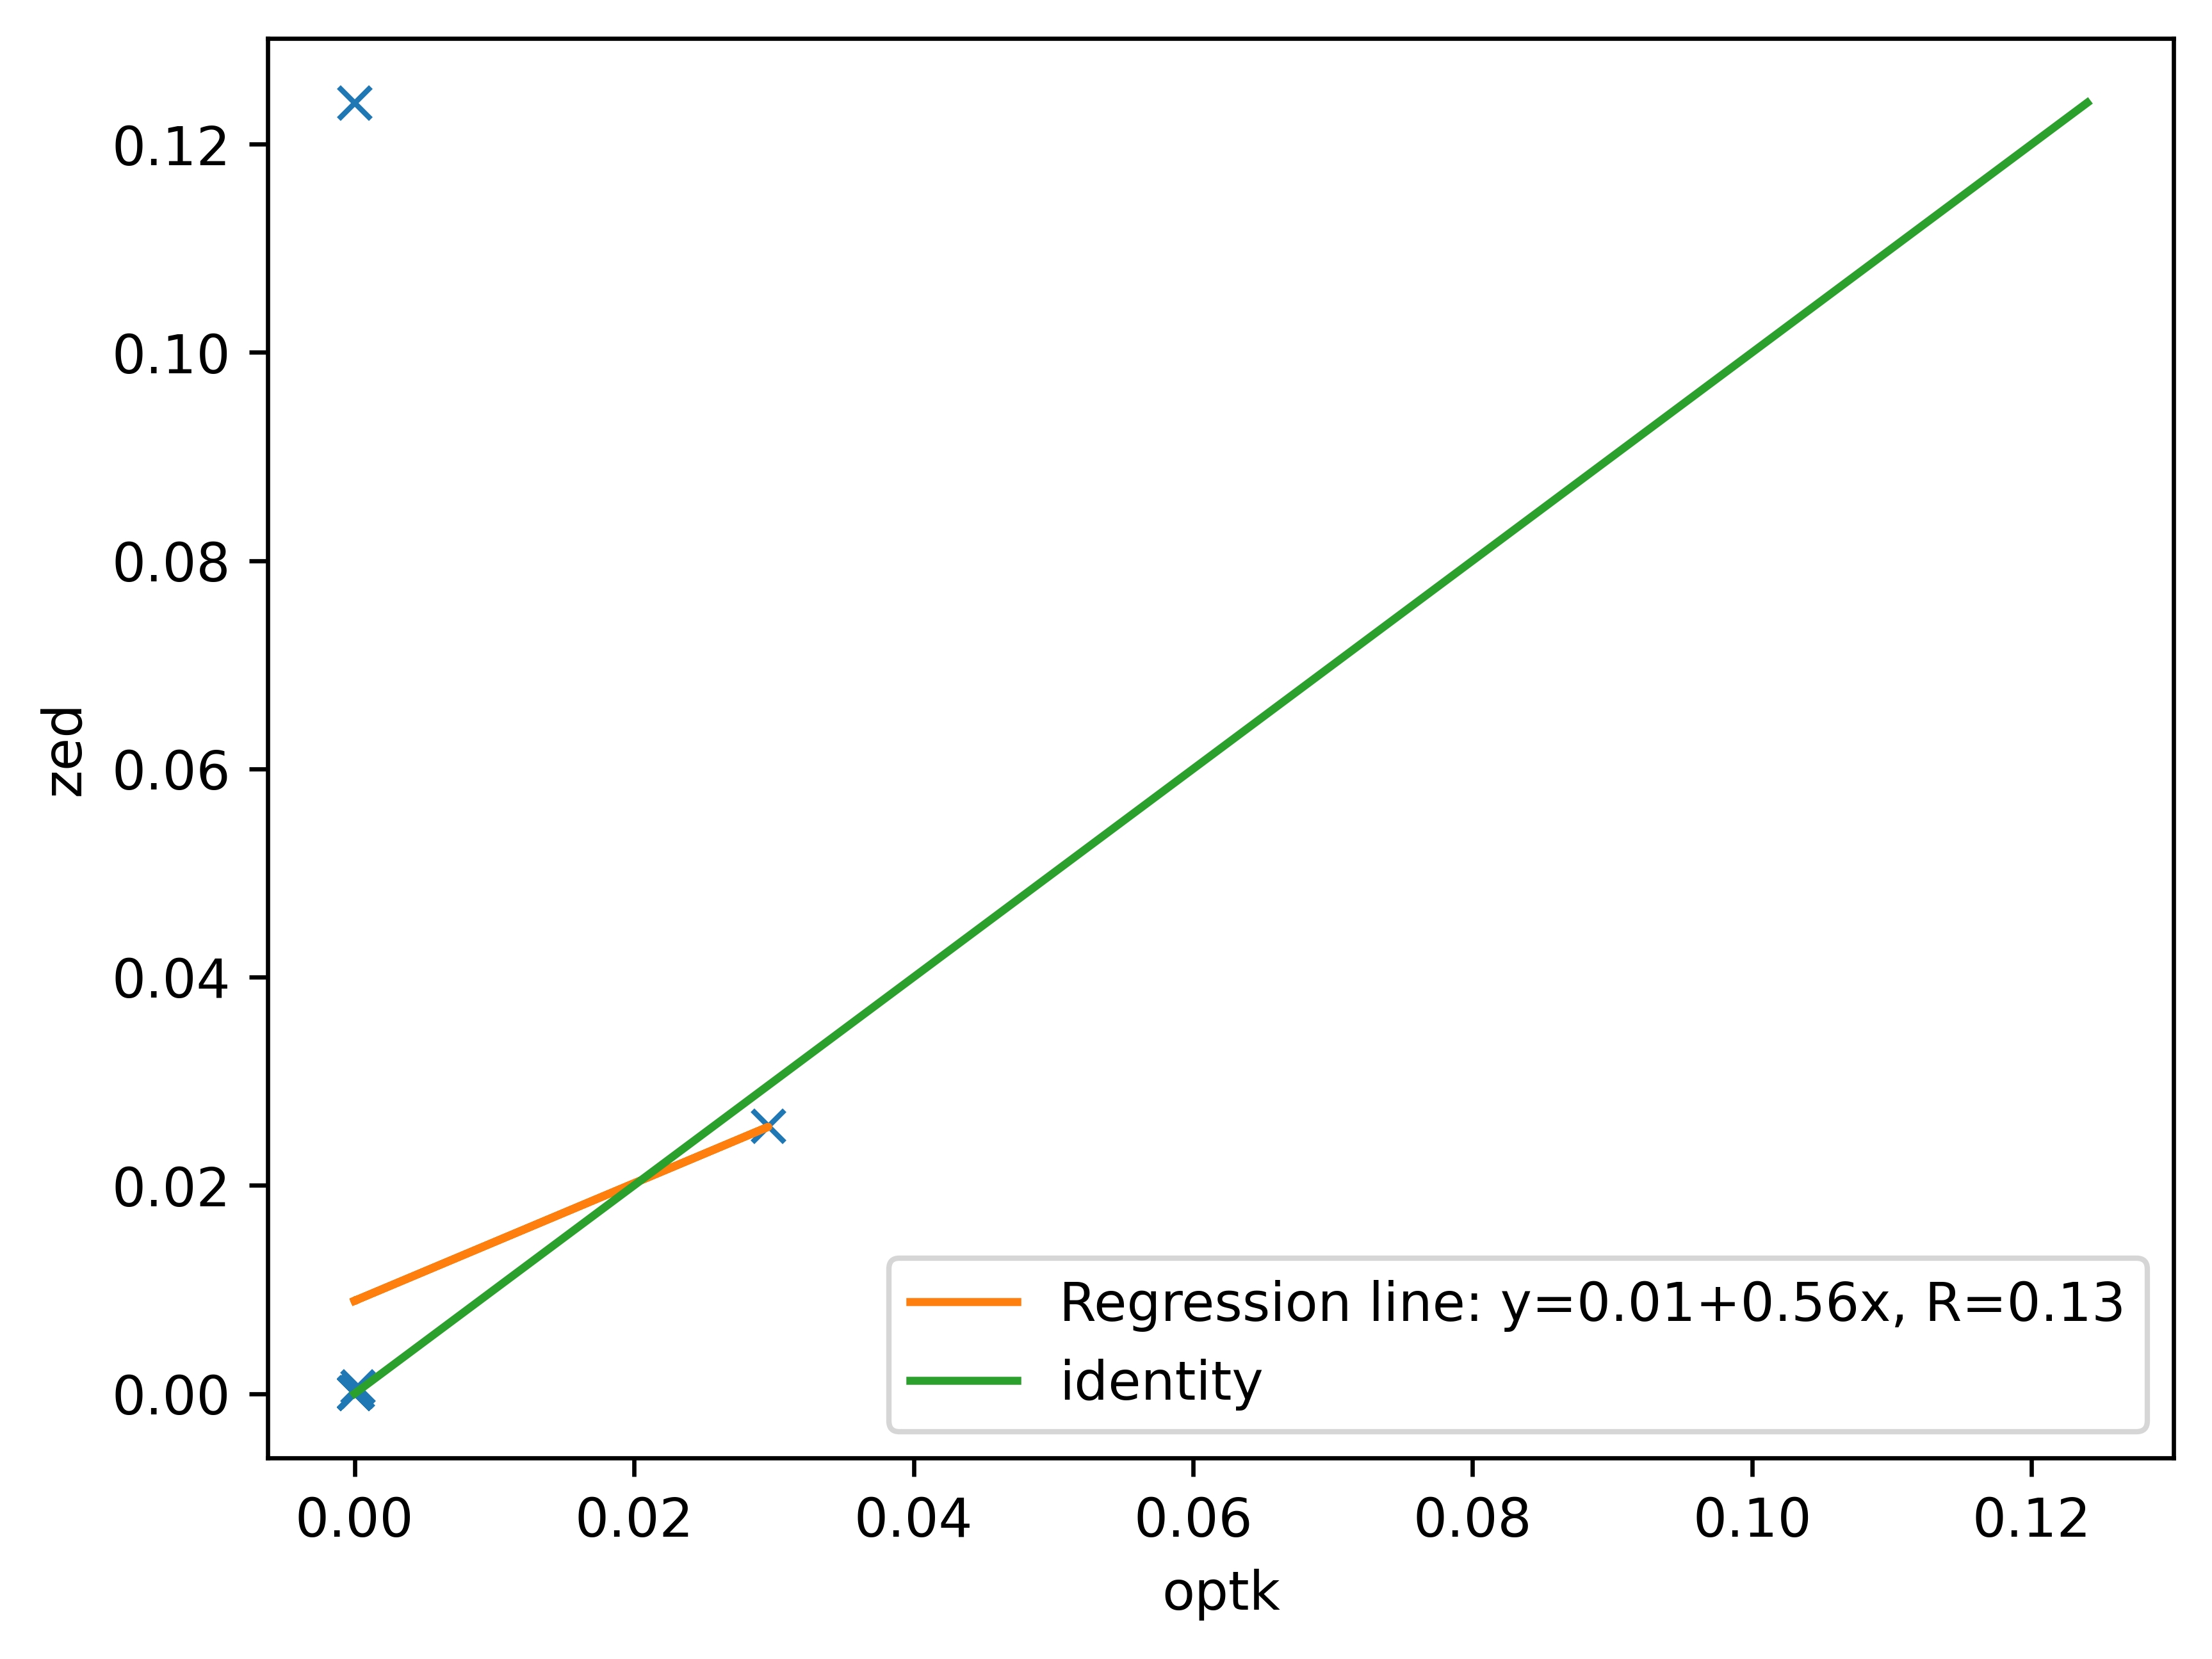
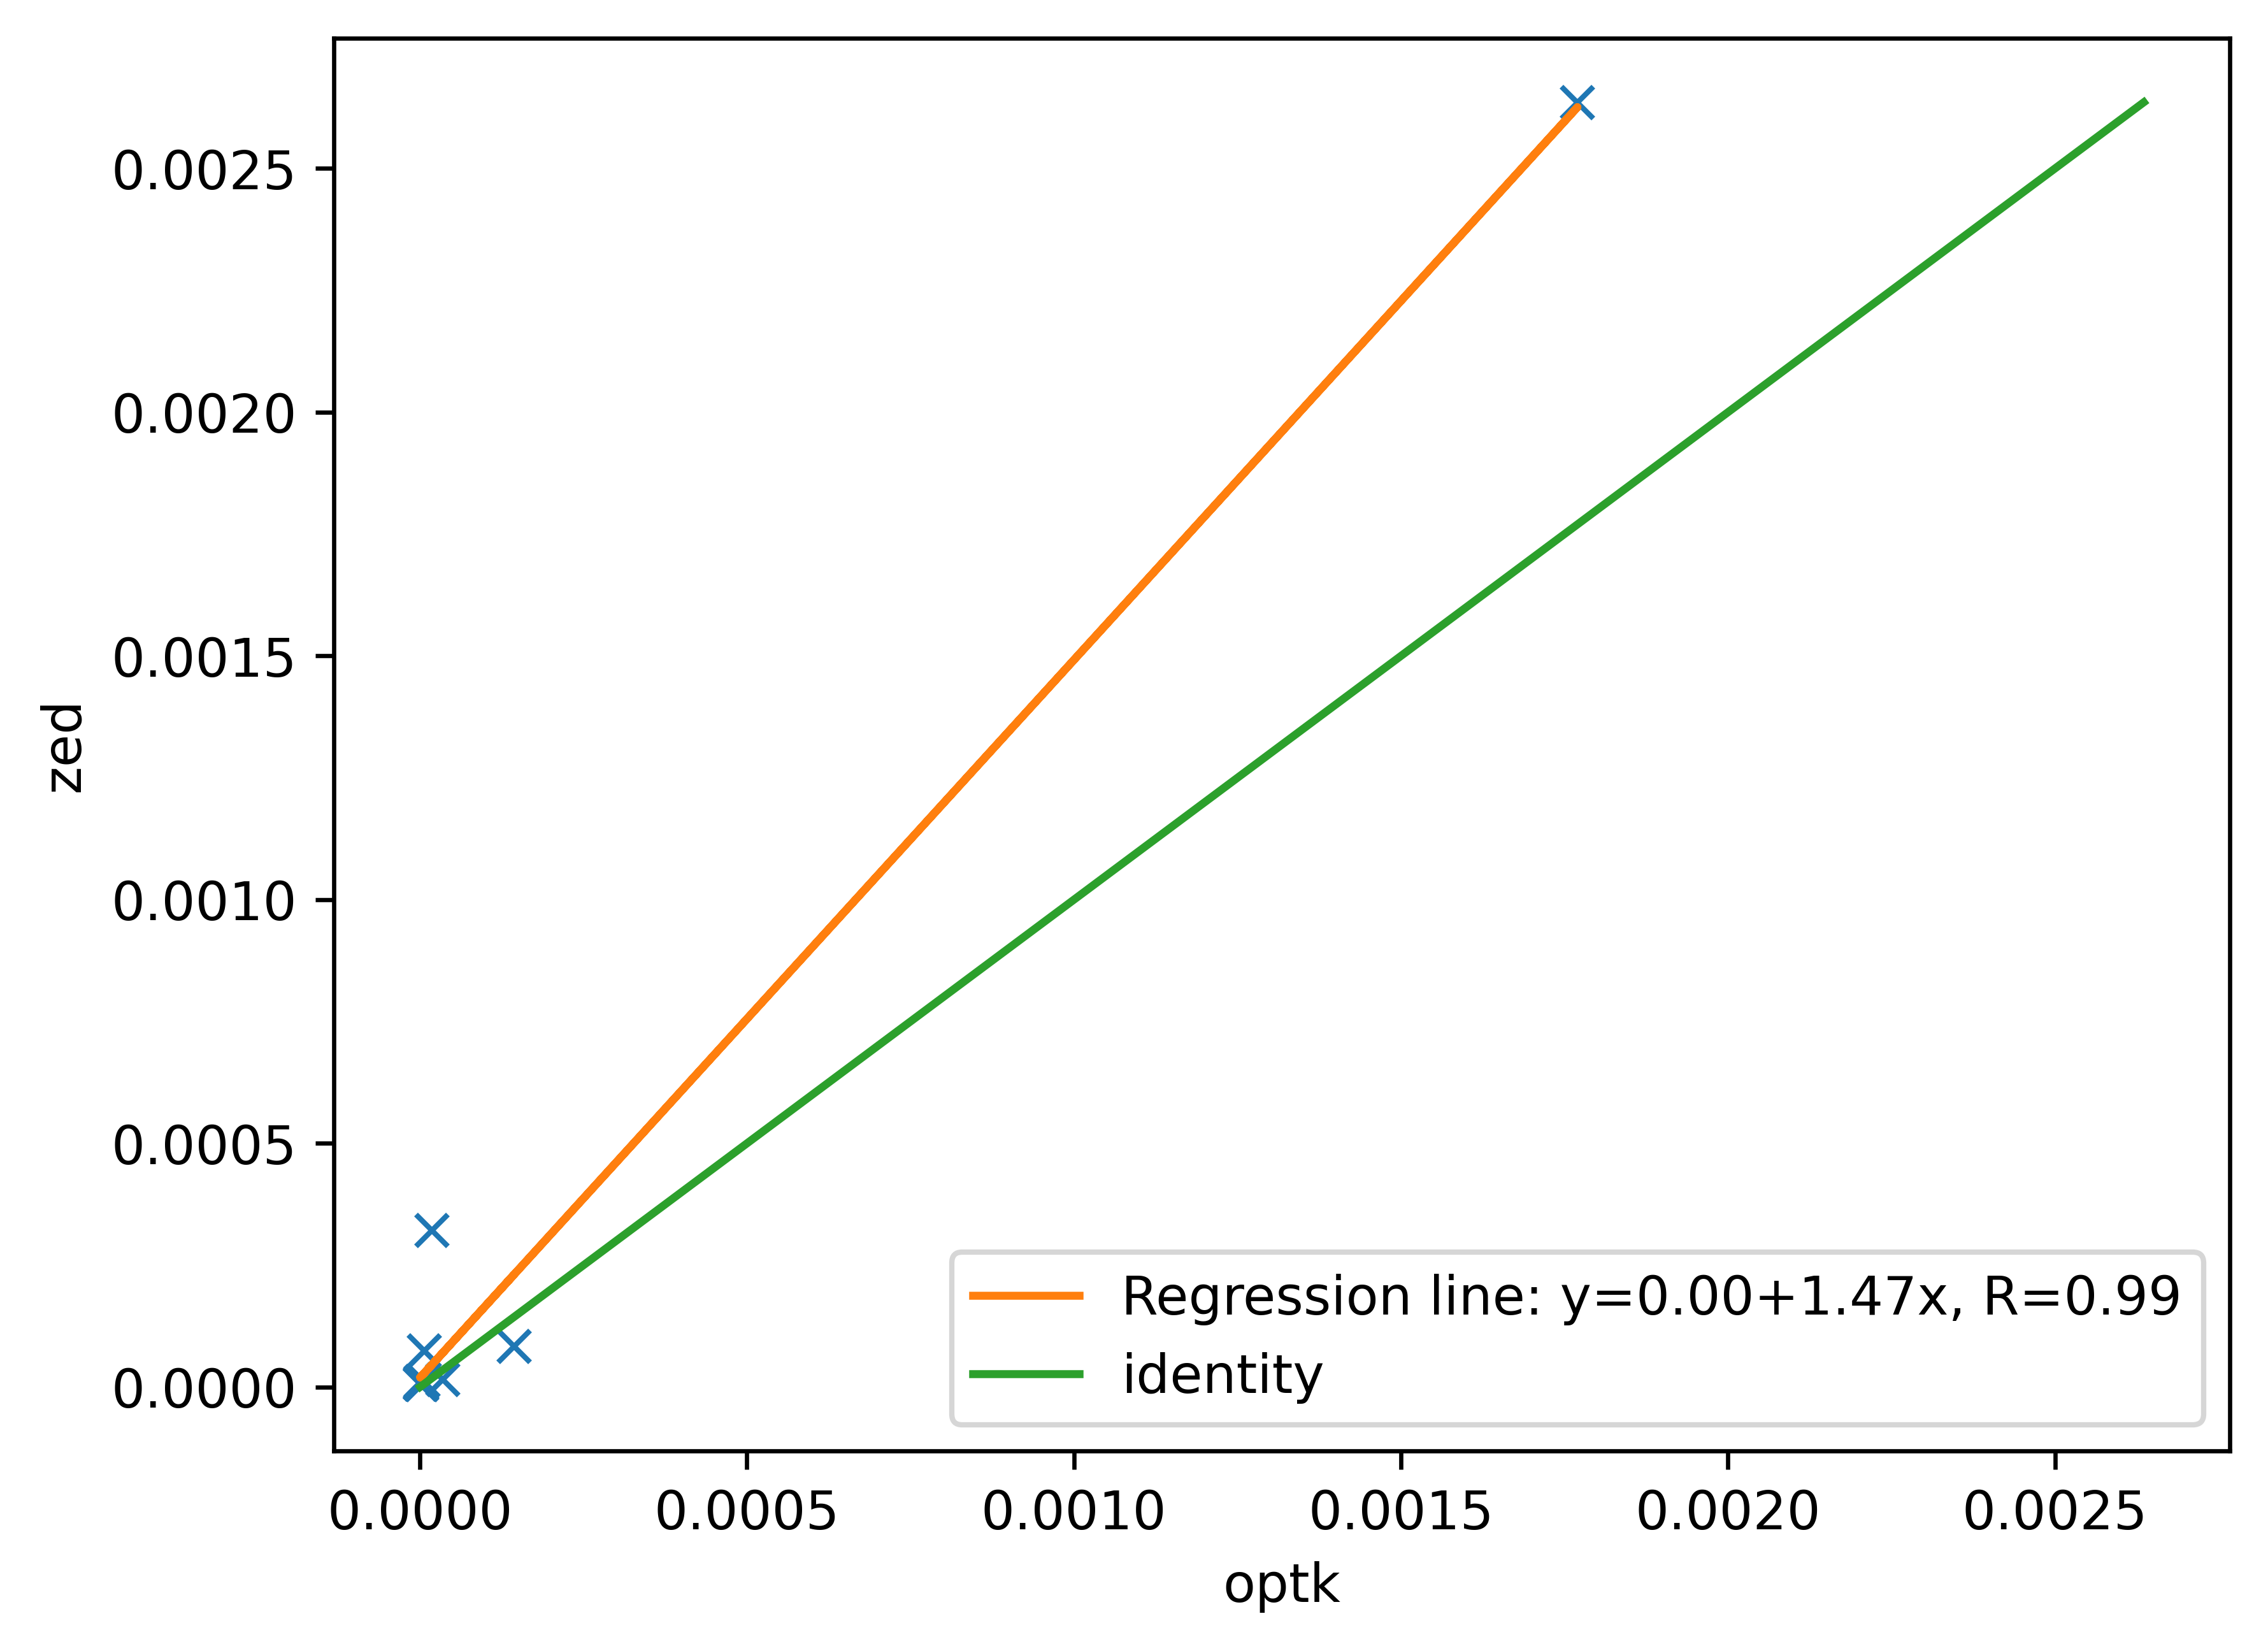
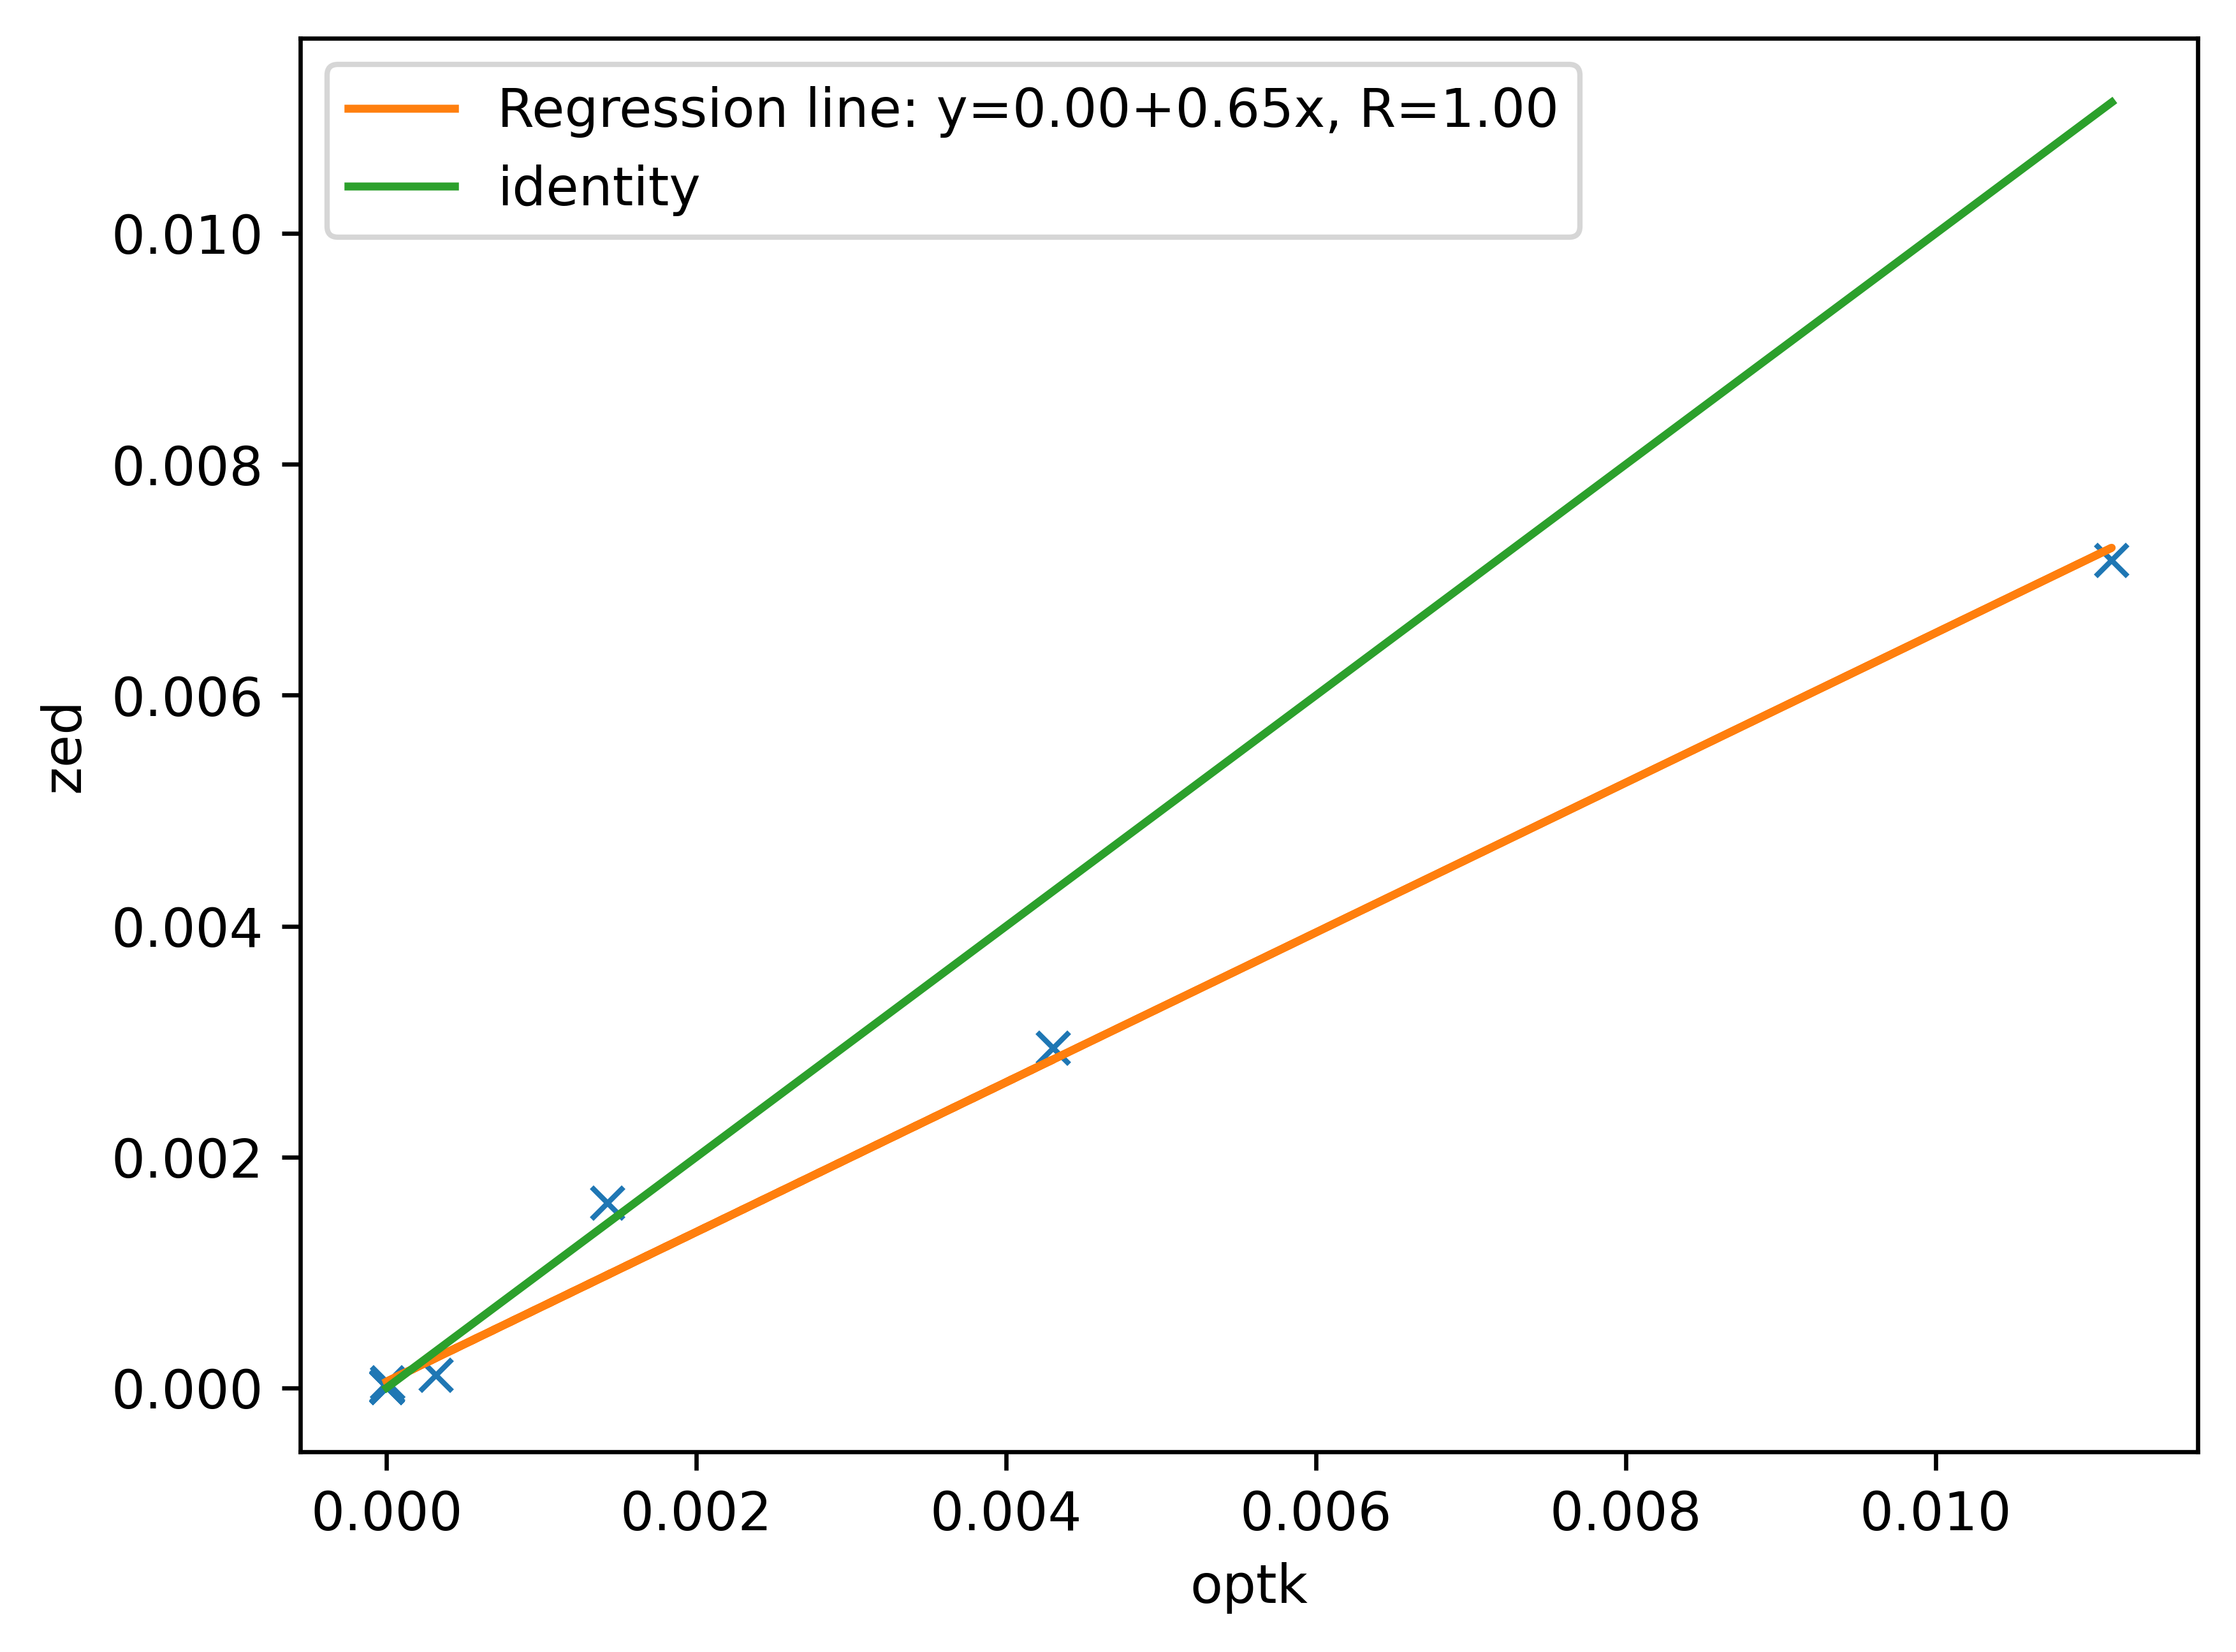
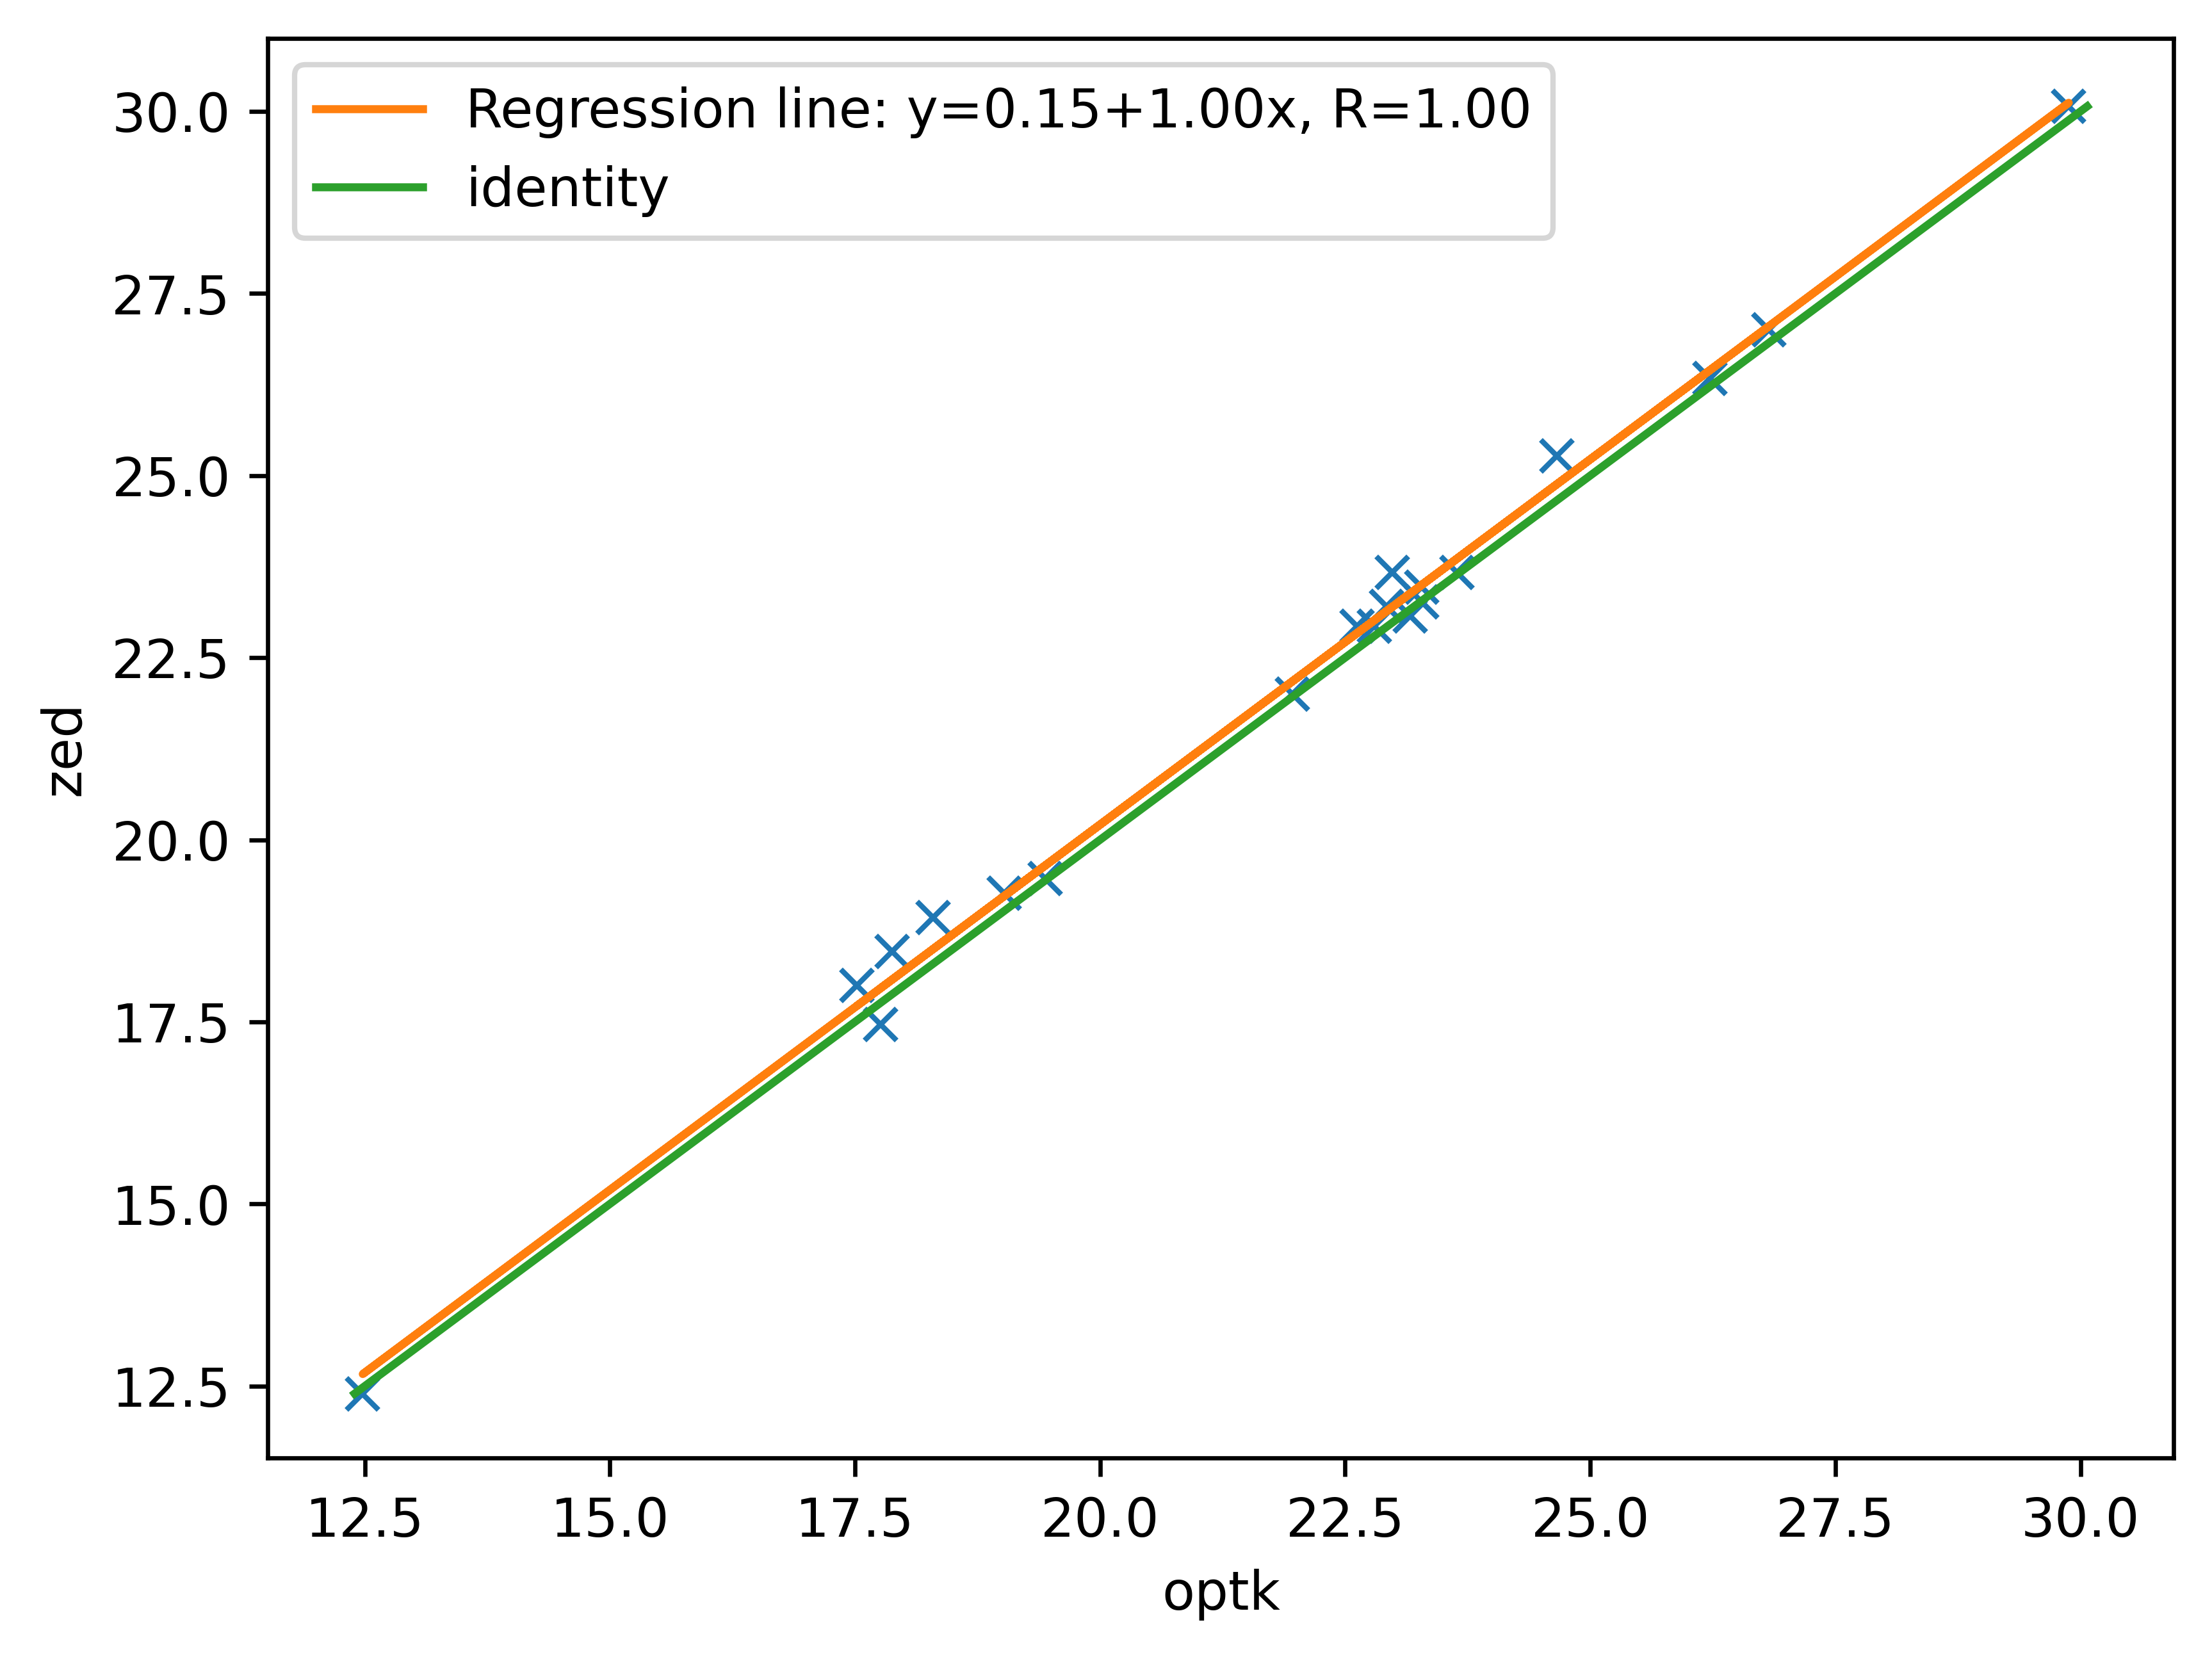
The individual samples for each of the metrics are plotted below. Every plot contains the values of the same metric for all the different runs. The plots compare the value acquired with the ZED SDK (y-axis) and the OptiTrack (x-axis). The linear regression is also plotted in each graphic (orange line), with the identity (green line) which can be used as a reference to check the proper fit of the data. The plots also show the precision and the repeatability of the data, when the samples are closer to the identity line, they are considered more precise.
Gait Speed Results
Time (s)
Left Stride Length (m)
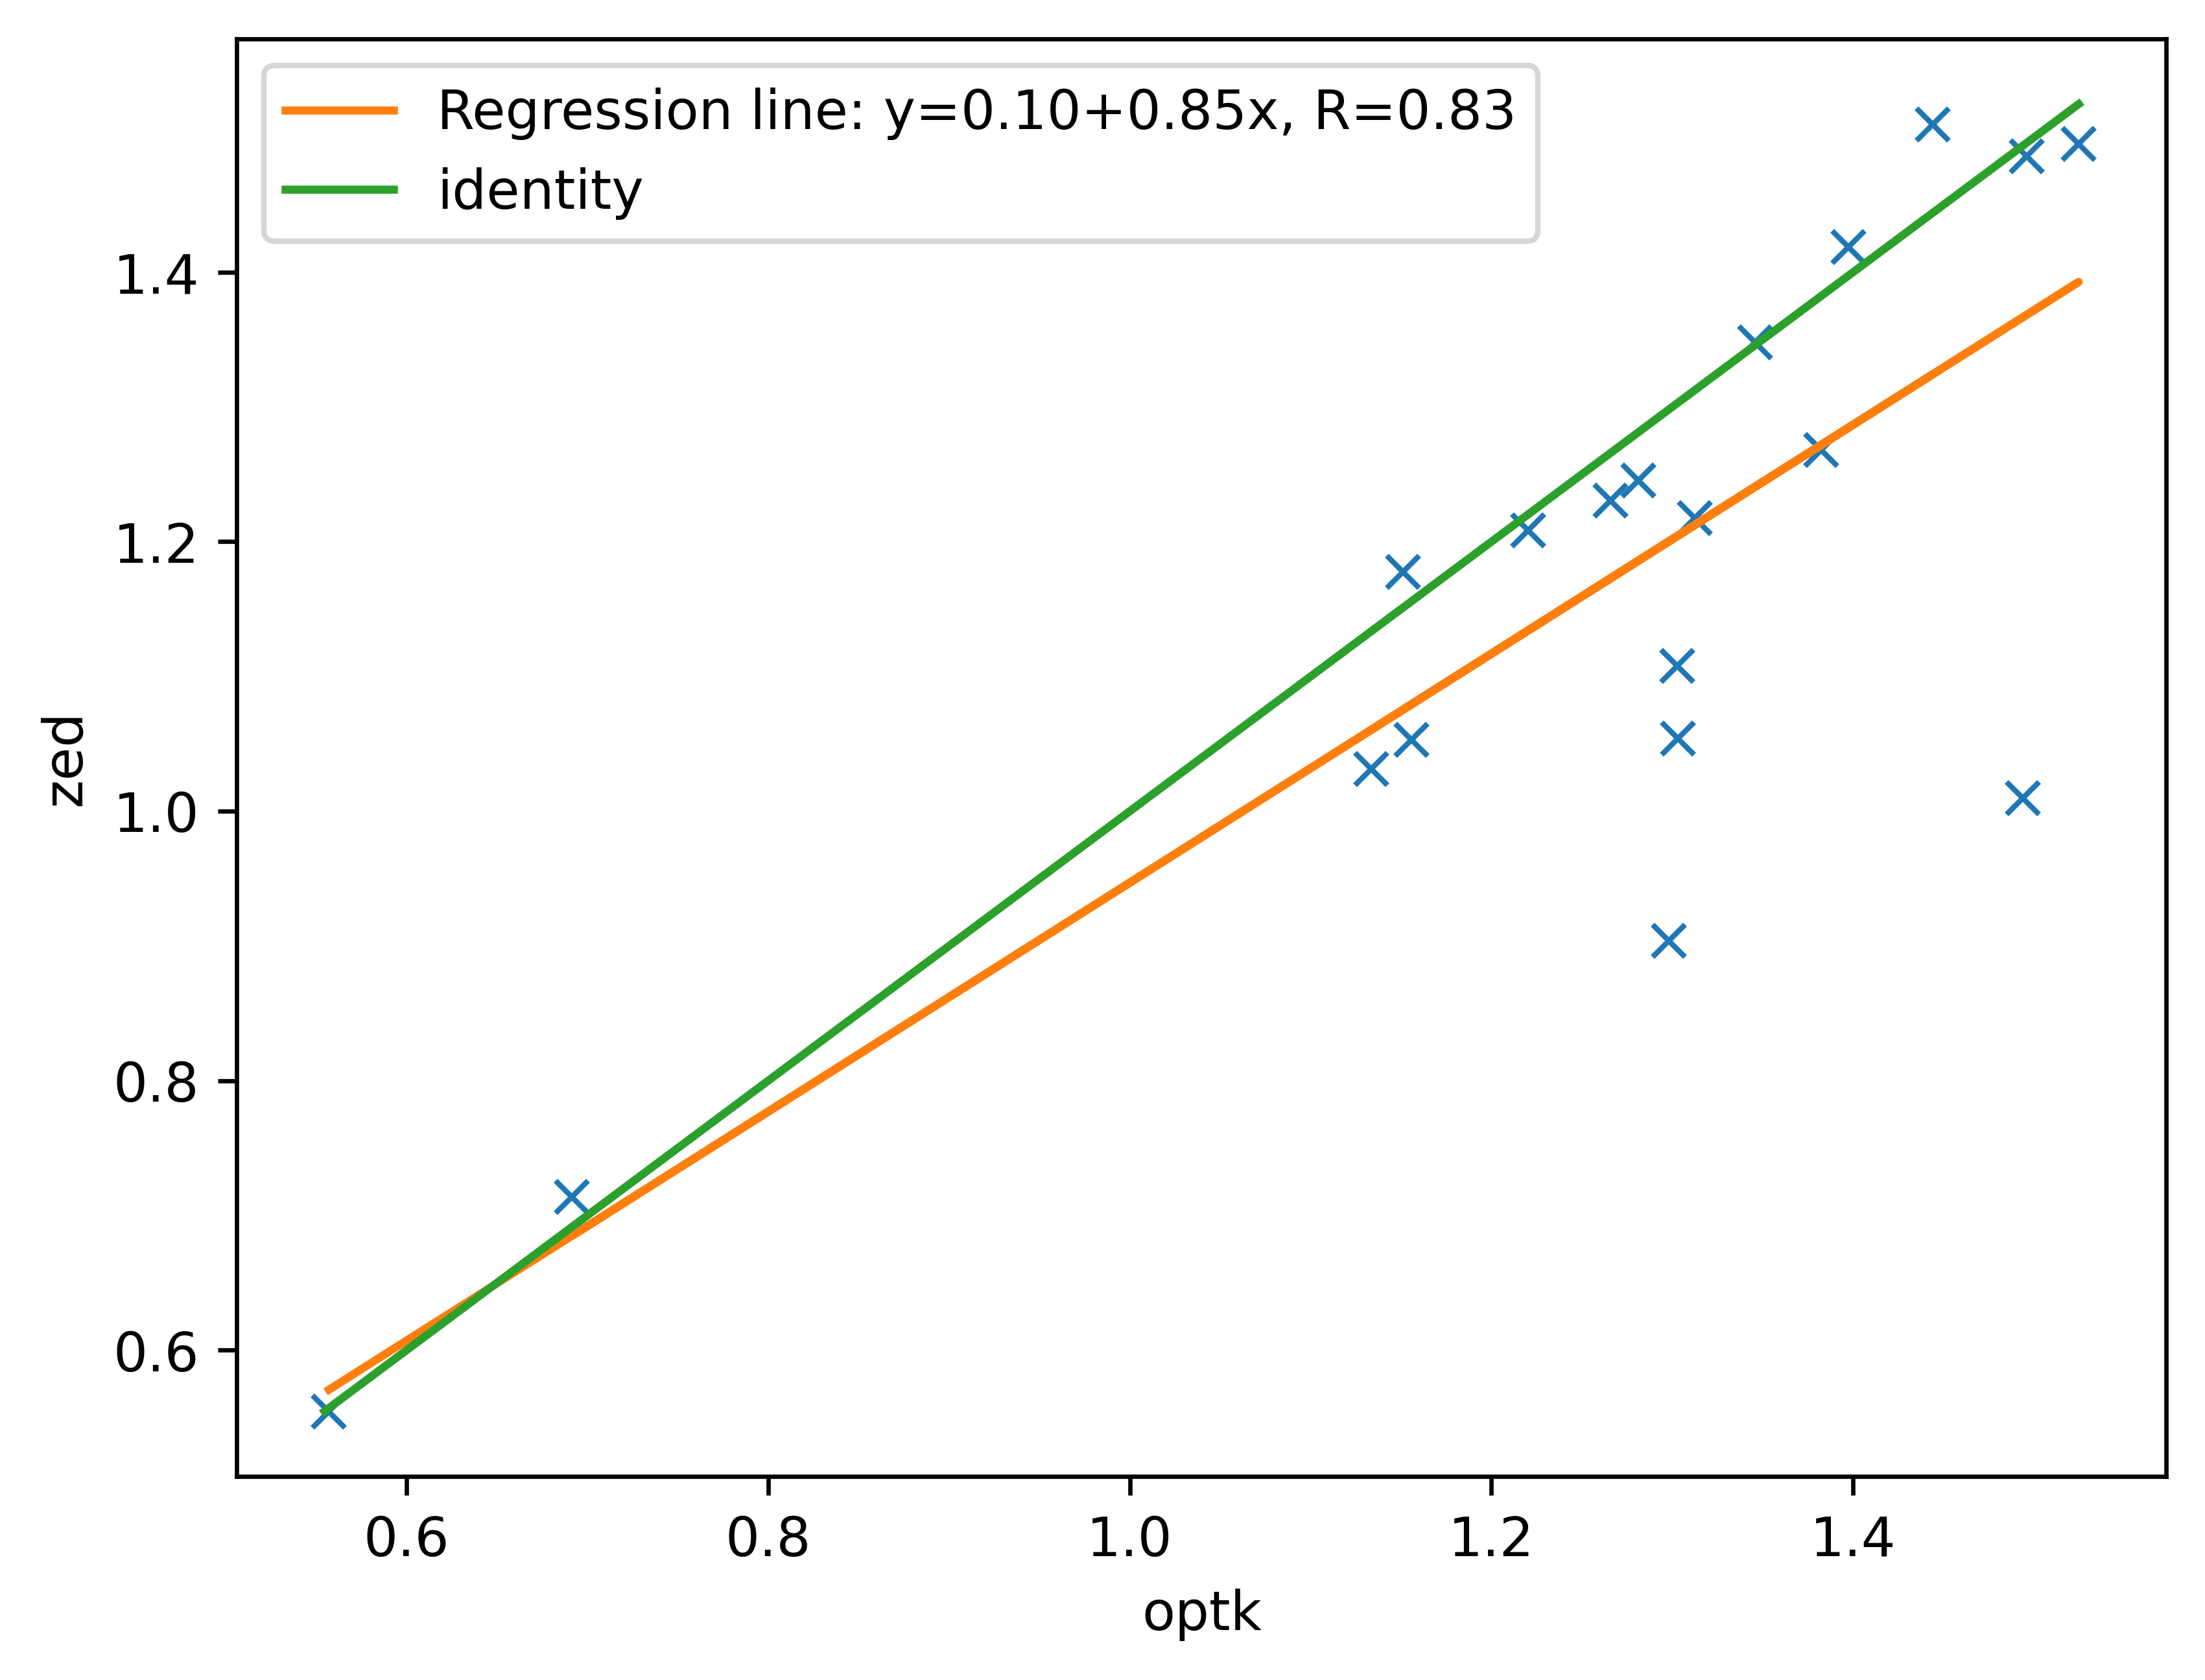
Left Stride Velocity (m/s)
Left Step Length (m)
Left Step Velocity (m/s)
Right Stride Length (m)
Right Stride Velocity (m/s)
Right Step Length (m)
Right Step Velocity (m/s)
Balance Ranges (m)
Balance Mean (m)
Number Steps
Left Step Width (m)
Right Step Width (m)
TUG Results
Time (s)
Left Stride Length (m)
Left Stride Velocity (m/s)
Left Step Length (m)
Left Step Velocity (m/s)
Right Stride Length (m)
Right Stride Velocity (m/s)
Right Step Length (m)
Right Step Velocity (m/s)
Balance Ranges (m)
Balance Mean (m)
Number Steps
Left Step Width (m)
Right Step Width (m)
Standing Balance Results
Box Together (m3)
Box Semi-Tandem (m3)
Box Tandem (m3)
5 Times Sit-Stand Results
Time (s)
Fatigue (s)