plot.h File Reference
Module to generate 2d plots.
More...
#include <stdio.h>
Go to the source code of this file.
Data Structures |
| struct | Tplot |
| | A 2D plot. More...
|
Defines |
| #define | SOLID_LINE 0 |
| | Solid line in 2d.
|
| #define | DASHED_LINE 1 |
| | Dashed line in 2d.
|
| #define | DOTTED_LINE 2 |
| | Dotted line in 2d.
|
Functions |
| void | InitPlot (const char *name, Tplot *p) |
| | Constructor.
|
| void | SetLineWidth (unsigned int width, Tplot *p) |
| | Changes the current line width.
|
| void | SetLineStyle (unsigned int style, Tplot *p) |
| | Changes the current line stype.
|
| void | SetOrigin (double offset_x, double offset_y, Tplot *p) |
| | Changes the current origin of the plot.
|
| void | SetPenColor (int color, Tplot *p) |
| | Changes the current pen color.
|
| void | SetFillColor (int color, Tplot *p) |
| | Changes the current fill color.
|
| void | SetFillIntensity (unsigned int intensity, Tplot *p) |
| | Changes the current fill intensity.
|
| void | SetDepth (unsigned int depth, Tplot *p) |
| | Changes the current plot depth.
|
| void | PlotCircle (double cx, double cy, double r, Tplot *p) |
| | Plots a circle.
|
| void | PlotRectangle (double x_left, double y_sup, double x_right, double y_inf, Tplot *p) |
| | Plots a rectangle.
|
| void | PlotTriangle (double x1, double y1, double x2, double y2, double x3, double y3, Tplot *p) |
| | Plots a triangle.
|
| void | PlotLine (double x0, double y0, double x1, double y1, Tplot *p) |
| | Plots a segment.
|
| void | PlotArrow (double x0, double y0, double x1, double y1, Tplot *p) |
| | Plots a segment with an arrow.
|
| void | PlotText (double x, double y, const char *text, Tplot *p) |
| | Plots a text.
|
| void | PlotAxis (const char *nx, double min_x, double max_x, const char *ny, double min_y, double max_y, double step, Tplot *p) |
| | Plots a X-Y axis.
|
| void | ClosePlot (Tplot *p) |
| | Destructor.
|
Detailed Description
Module to generate 2d plots. Right now the output is in xfig format.
This could be re-implement this using libplot. However this is not urgent at all since 2d plots are not very useful.
- See also:
- Tplot, plot.c, Tplot3d, plot3d.h
Definition in file plot.h.
Define Documentation
Dashed line in 2d.
- See also:
- plot.c
Definition at line 35 of file plot.h.
Dotted line in 2d.
- See also:
- plot.c
Definition at line 43 of file plot.h.
Function Documentation
| void InitPlot |
( |
const char * |
name, |
|
|
Tplot * |
p | |
|
) |
| | |
| void SetLineWidth |
( |
unsigned int |
width, |
|
|
Tplot * |
p | |
|
) |
| | |
Changes the current line width. It will be used to plot elements from this point on.
- Parameters:
-
| width | New line width. |
| p | The plot to update. |
Definition at line 97 of file plot.c.
References Tplot::line_width.
| void SetLineStyle |
( |
unsigned int |
style, |
|
|
Tplot * |
p | |
|
) |
| | |
Changes the current line style. It will be used to plot elements from this point on.
- Parameters:
-
| style | New line style. Possible styles are SOLID_LINE, DASHED_LINE, DOTTED_LINE |
| p | The plot to update. |
- See also:
- defines.h
Definition at line 105 of file plot.c.
References Tplot::line_style.
Referenced by PlotAxis().
| void SetOrigin |
( |
double |
offset_x, |
|
|
double |
offset_y, |
|
|
Tplot * |
p | |
|
) |
| | |
Changes the current origin of the plot. Elements from now on will be refered to this new origin.
- Parameters:
-
| offset_x | New offset in x for the origin. |
| offset_y | New offset in y for the origin. |
| p | The plot to update. |
Definition at line 116 of file plot.c.
References Tplot::offset_x, and Tplot::offset_y.
Referenced by main().
| void SetPenColor |
( |
int |
color, |
|
|
Tplot * |
p | |
|
) |
| | |
Changes the current pen color. Elements from now on will be plotted with this color. Possible colors are:
- -1:default 0:black 1:blue 2:green 3:cyan 4:red 5 magenta 6 yellow 7 white 8 blue4 9 blue3 10 blue2 11 ltblue 12 green4 12 green3 14 green2 15 cyan4 16 cyan3 17 cyan2 18 read4 19 read3 20 read2 21 magenta4 22 magenta3 23 magenta2 24 brown4 25 brown3 26 brown2 27 pink4 28 pink3 29 pink2 30 pink 31 gold.
- Parameters:
-
| color | The new pen color. |
| p | The plot to update. |
Definition at line 122 of file plot.c.
References Tplot::pen_color.
| void SetFillColor |
( |
int |
color, |
|
|
Tplot * |
p | |
|
) |
| | |
Changes the current fill color. Elements from now on will be filled with this color. Possible colors are:
- -1:default 0:black 1:blue 2:green 3:cyan 4:red 5 magenta 6 yellow 7 white 8 blue4 9 blue3 10 blue2 11 ltblue 12 green4 12 green3 14 green2 15 cyan4 16 cyan3 17 cyan2 18 read4 19 read3 20 read2 21 magenta4 22 magenta3 23 magenta2 24 brown4 25 brown3 26 brown2 27 pink4 28 pink3 29 pink2 30 pink 31 gold.
- Parameters:
-
| color | The new fill color. |
| p | The plot to update. |
Definition at line 128 of file plot.c.
References Tplot::fill_color.
| void SetFillIntensity |
( |
unsigned int |
intensity, |
|
|
Tplot * |
p | |
|
) |
| | |
Changes the current fill intensity. Elements from now on will be filled with this intensity. The valid ranges for intensities are [0,20] with 0 no-fill and 20 full_fill.
- Parameters:
-
| intensity | The new fill intensity. |
| p | The plot to update. |
Definition at line 134 of file plot.c.
References Tplot::fill_intensity.
| void SetDepth |
( |
unsigned int |
depth, |
|
|
Tplot * |
p | |
|
) |
| | |
Changes the current plot depth. Elements from now on will be plotted at this depth.
- Parameters:
-
| depth | The new depth. |
| p | The plot to update. |
Definition at line 141 of file plot.c.
References Tplot::depth.
| void PlotCircle |
( |
double |
cx, |
|
|
double |
cy, |
|
|
double |
r, |
|
|
Tplot * |
p | |
|
) |
| | |
Adds a circle to a plot.
- Parameters:
-
| cx | X coordinate for the center of the circle. |
| cy | Y coordinate for the center of the circle. |
| r | Radius for the circle. |
| p | The plot to update. |
Definition at line 149 of file plot.c.
References CM2POINTS, Tplot::f, PRINTXFIGPREAMBLE, and USER2XFIG.
| void PlotRectangle |
( |
double |
x_left, |
|
|
double |
y_sup, |
|
|
double |
x_right, |
|
|
double |
y_inf, |
|
|
Tplot * |
p | |
|
) |
| | |
Adds a rectangle to a plot.
- Parameters:
-
| x_left | X-lower coordinate. |
| y_sup | Y-upper coordinate. |
| x_right | X-upper coordinate. |
| y_inf | Y-lower coordinate. |
| p | The plot to update. |
Definition at line 165 of file plot.c.
References Tplot::f, POINTS2CM, PRINTXFIGPREAMBLE, and USER2XFIG.
Referenced by main().
| void PlotTriangle |
( |
double |
x1, |
|
|
double |
y1, |
|
|
double |
x2, |
|
|
double |
y2, |
|
|
double |
x3, |
|
|
double |
y3, |
|
|
Tplot * |
p | |
|
) |
| | |
Adds a triangle to a plot.
- Parameters:
-
| x1 | X coordinate for the first point of the triangle. |
| y1 | Y coordinate for the first point of the triangle. |
| x2 | X coordinate for the second point of the triangle. |
| y2 | Y coordinate for the second point of the triangle. |
| x3 | X coordinate for the third point of the triangle. |
| y3 | Y coordinate for the third point of the triangle. |
| p | The plot to update. |
Definition at line 194 of file plot.c.
References Tplot::f, PRINTXFIGPREAMBLE, and USER2XFIG.
| void PlotLine |
( |
double |
x0, |
|
|
double |
y0, |
|
|
double |
x1, |
|
|
double |
y1, |
|
|
Tplot * |
p | |
|
) |
| | |
Adds a segment to a plot.
- Parameters:
-
| x0 | X coordinate for the origin of the segment. |
| y0 | Y coordinate for the origin of the segment. |
| x1 | X coordinate for the end of the segment. |
| y1 | Y coordinate for the end of the segment. |
| p | The plot to update. |
Definition at line 215 of file plot.c.
References Tplot::f, PRINTXFIGPREAMBLE, and USER2XFIG.
Referenced by PlotAxis().
| void PlotArrow |
( |
double |
x0, |
|
|
double |
y0, |
|
|
double |
x1, |
|
|
double |
y1, |
|
|
Tplot * |
p | |
|
) |
| | |
Adds a segment with an arrow at the end to a plot.
- Parameters:
-
| x0 | X coordinate for the origin of the arrow. |
| y0 | Y coordinate for the origin of the arrow. |
| x1 | X coordinate for the end of the arrow. |
| y1 | Y coordinate for the end of the arrow. |
| p | The plot to update. |
Definition at line 227 of file plot.c.
References Tplot::f, PRINTXFIGPREAMBLE, and USER2XFIG.
Referenced by PlotAxis().
| void PlotText |
( |
double |
x, |
|
|
double |
y, |
|
|
const char * |
text, |
|
|
Tplot * |
p | |
|
) |
| | |
Adds a text with to a plot.
- Parameters:
-
| x | X coordinate for the text. |
| y | Y coordinate for the text. |
| text | The text to plot. |
| p | The plot to update. |
Definition at line 239 of file plot.c.
References Tplot::f, and USER2XFIG.
Referenced by PlotAxis().
| void PlotAxis |
( |
const char * |
nx, |
|
|
double |
min_x, |
|
|
double |
max_x, |
|
|
const char * |
ny, |
|
|
double |
min_y, |
|
|
double |
max_y, |
|
|
double |
step, |
|
|
Tplot * |
p | |
|
) |
| | |
Adds X-Y axis to the plot.
- Parameters:
-
| nx | Label for the X axis. |
| min_x | Value at which the X axis have to start. |
| max_x | Value at which the X axis have to end. |
| ny | Label for the Y axis. |
| min_y | Value at which the Y axis have to start. |
| max_y | Value at which the Y axis have to end. |
| step | Separation between ticks along the axis. |
| p | The plot to update. |
Definition at line 247 of file plot.c.
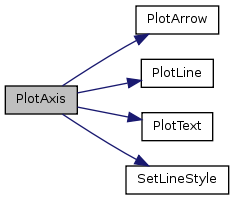
References PlotArrow(), PlotLine(), PlotText(), SetLineStyle(), and SOLID_LINE.
Referenced by main().
| void ClosePlot |
( |
Tplot * |
p |
) |
|
Flushes the information to the output file, closes the file, and frees all the allocated memory for the plot structure.
- Parameters:
-
Definition at line 275 of file plot.c.
References Tplot::f.
Referenced by main().
|